Fig. 5
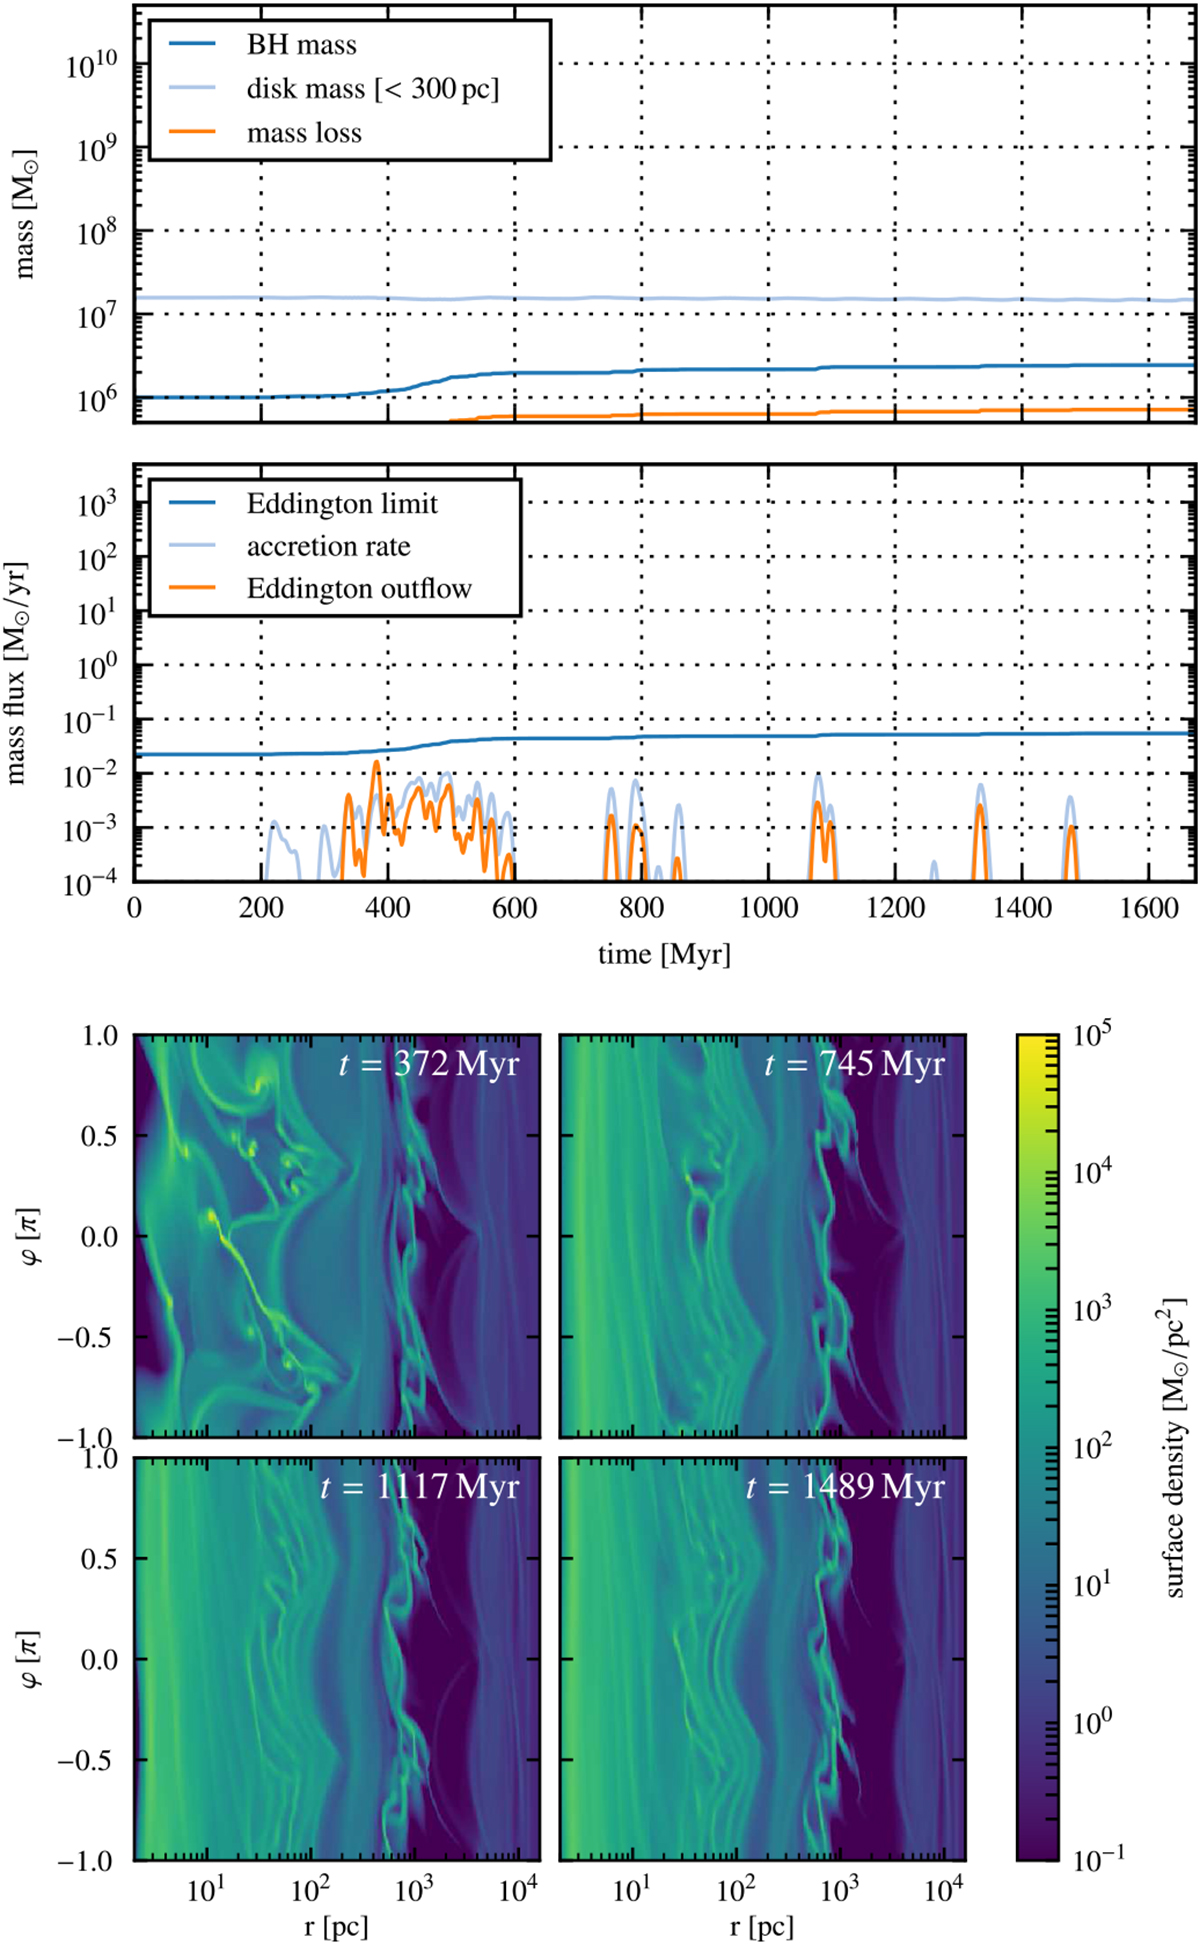
Time evolution of the simulation with Σ0 = 10 M⊙ pc−2 and speed of sound cs = 3 km s−1, as an example of weak accretion. Top: after the bar is switched on the accretion rate rises for a short period. Afterward it declines and falls below 10−4 M⊙ yr−1. Bottom: at the beginning of the simulation the surface density shows fragmentation in the inner region. Later the flow in the inner disk is laminar. Eccentric nuclear rings can be identified at 80 pc and 800 pc.
Current usage metrics show cumulative count of Article Views (full-text article views including HTML views, PDF and ePub downloads, according to the available data) and Abstracts Views on Vision4Press platform.
Data correspond to usage on the plateform after 2015. The current usage metrics is available 48-96 hours after online publication and is updated daily on week days.
Initial download of the metrics may take a while.