Fig. 21
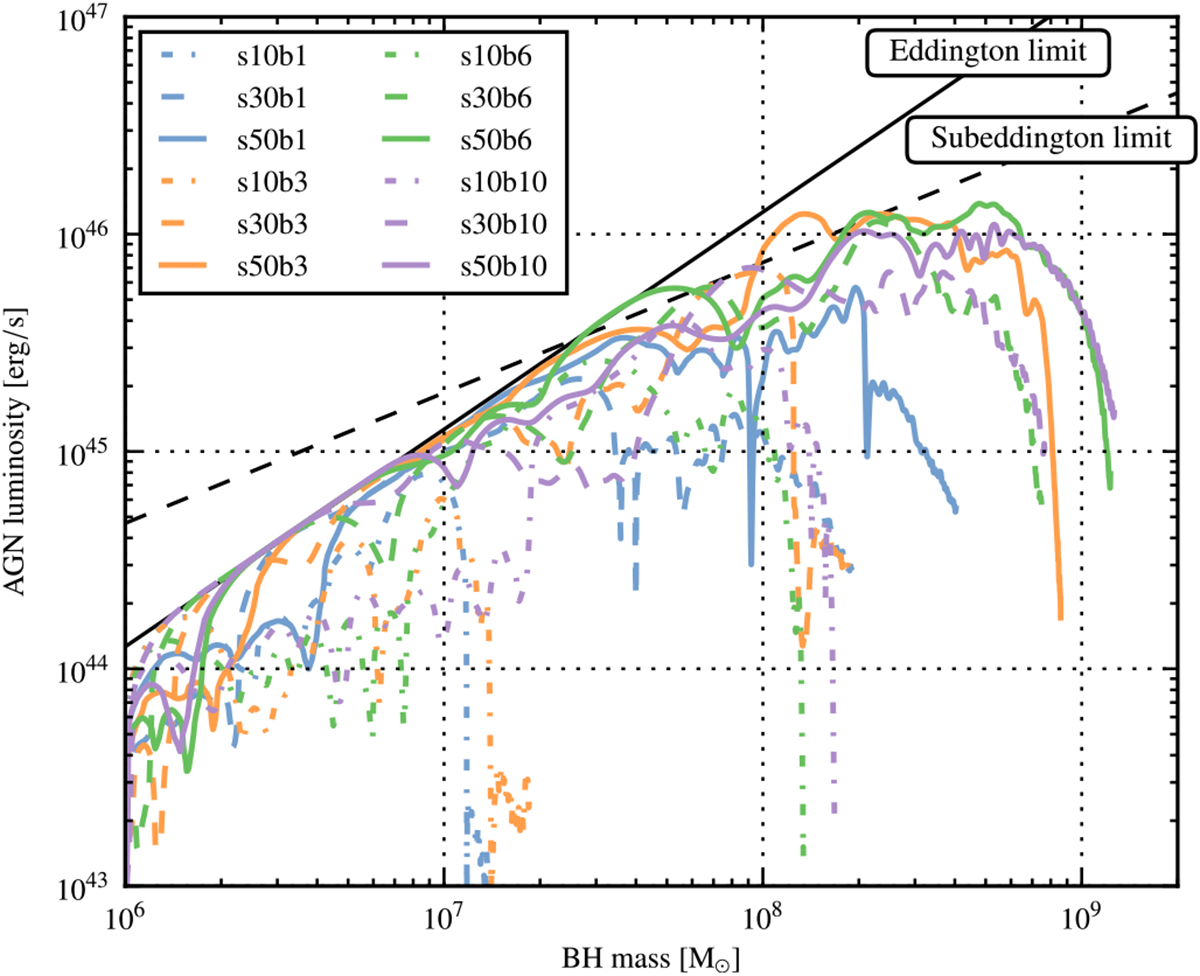
Evolutionary tracks for the black holes of galaxy simulations with cooling. All simulations accrete for a long time near the Eddington limit (black line). Depending on the initial conditions they leave this evolutionary path at different black hole masses and then show strongly declining AGN luminosities. The dashed black line indicates the sub-Eddington limit for redshifts of 0.6 < z < 0.8 from Steinhardt & Elvis (2010).
Current usage metrics show cumulative count of Article Views (full-text article views including HTML views, PDF and ePub downloads, according to the available data) and Abstracts Views on Vision4Press platform.
Data correspond to usage on the plateform after 2015. The current usage metrics is available 48-96 hours after online publication and is updated daily on week days.
Initial download of the metrics may take a while.