Fig. 20
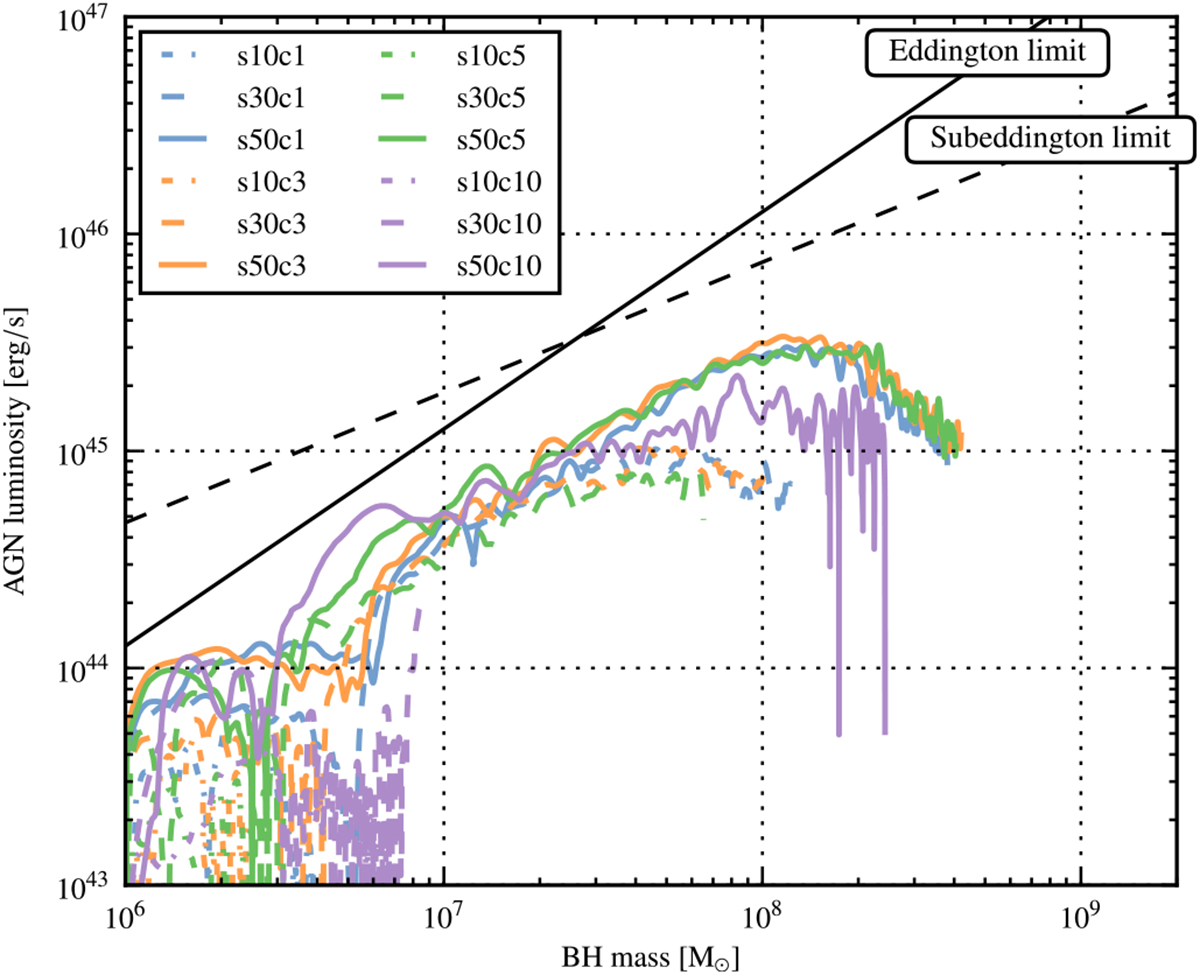
Evolutionary tracks of the black holes in the isothermal simulations. Since only the massive simulations lead to appreciable black hole masses, the mass-poor simulations remain in the lower left corner. The other simulations move on a path parallel to the Eddington limit (black line), then they bend and feature a constant accretion rate. The dashed black line indicates the sub-Eddington limit for redshifts of 0.6 < z < 0.8 from Steinhardt & Elvis (2010). It does not pose a strong limit for these simulations.
Current usage metrics show cumulative count of Article Views (full-text article views including HTML views, PDF and ePub downloads, according to the available data) and Abstracts Views on Vision4Press platform.
Data correspond to usage on the plateform after 2015. The current usage metrics is available 48-96 hours after online publication and is updated daily on week days.
Initial download of the metrics may take a while.