Free Access
Fig. 10
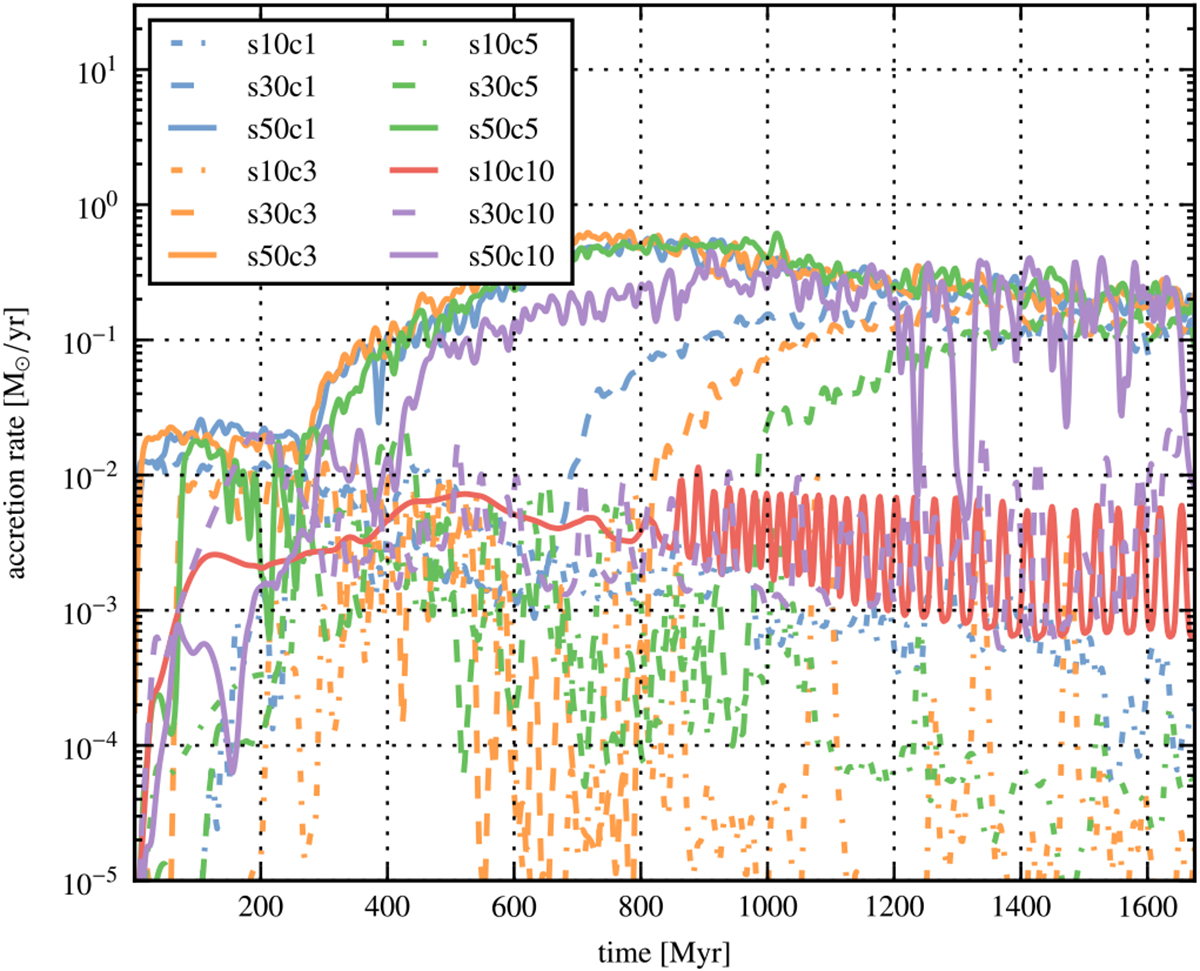
Plot of the accretion rates of all isothermal simulations. It is clearly visible that the simulations all lead either to strong accretion of more than 0.1 M⊙ yr−1 or to weak accretion of less than 0.01 M⊙ yr−1. Additionally, all simulations exhibit strong variations in the accretion rate.
Current usage metrics show cumulative count of Article Views (full-text article views including HTML views, PDF and ePub downloads, according to the available data) and Abstracts Views on Vision4Press platform.
Data correspond to usage on the plateform after 2015. The current usage metrics is available 48-96 hours after online publication and is updated daily on week days.
Initial download of the metrics may take a while.