Fig. 4
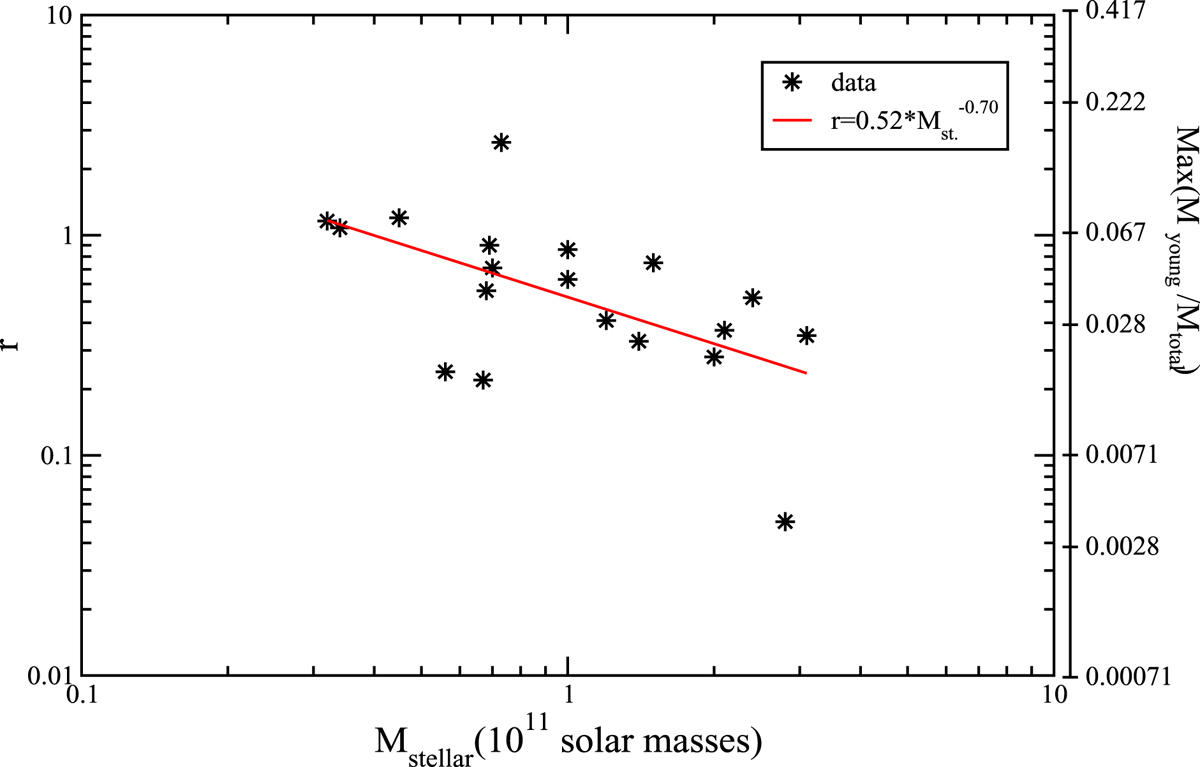
Log-log plot of the ratio r vs. an estimated stellar mass of the sample in L17 (neglecting the mass of the young stars and assuming the age of the old population in all of the galaxies to be 1.5 Gyr). In the right side, the equivalent scale of the maximum ratio of young stellar mass with respect to the total is given, assuming a minimum factor of 14 in the M stellar/L 4000 Å between old and young population. The best power-law fit is given by the solid line.
Current usage metrics show cumulative count of Article Views (full-text article views including HTML views, PDF and ePub downloads, according to the available data) and Abstracts Views on Vision4Press platform.
Data correspond to usage on the plateform after 2015. The current usage metrics is available 48-96 hours after online publication and is updated daily on week days.
Initial download of the metrics may take a while.