| Issue |
A&A
Volume 614, June 2018
|
|
|---|---|---|
| Article Number | C3 | |
| Number of page(s) | 1 | |
| Section | Letters to the Editor | |
| DOI | https://doi.org/10.1051/0004-6361/201731595e | |
| Published online | 22 June 2018 | |
Letter to the Editor
Anti-correlation between multiplicity and orbital properties in exoplanetary systems as a possible record of their dynamical histories (Corrigendum)
1
Space Science Data Center (SSDC) – ASI,
Via del Politecnico snc,
00133
Roma,
Italy
e-mail: This email address is being protected from spambots. You need JavaScript enabled to view it.
2
INAF-OAR,
Via Frascati 33,
00078
Monte Porzio Catone,
Italy
3
INAF-IAPS,
Via del Fosso del Cavaliere 100,
00133
Roma,
Italy
e-mail: This email address is being protected from spambots. You need JavaScript enabled to view it.
4
Departamento de Física, Universidad de Atacama,
Copayapu 485,
Copiapó,
Chile
Received:
18
April
2018
Accepted:
20
April
2018
Key words: methods: statistical / techniques: radial velocities / planets and satellites: dynamical evolution and stability / errata, addenda
We correct one error that appeared in Zinzi & Turrini (2017, hereafter Paper I).
We report an error in the generation of Fig. 3 in Paper I, showing the preliminary analysis of the anti-correlation between the angular momentum deficit (AMD; Laskar 2000) and multiplicity (M) of exoplanetary systems. The correct plot is shown in Fig. 1 of this corrigendum. As can be seen, albeit a lower value is found for M = 3 with respect to the trend, the general decreasing trend observed in Paper I is confirmed.
The slope obtained when considering the so-called “strict selection” dataset of Paper I (i.e. data with known uncertainties on the orbital and physical parameters of the exoplanets) appears steeper than the slope associated with that of the “large selection” case (i.e. exoplanets for which the uncertainties are not necessarily available) and seems to fit better the case of TRAPPIST-1.
As discussed in Paper I, this analysis should be only considered preliminary because of the limited number of exosystems in our current dataset, and the AMD-multiplicity anti-correlation will need to be further verified once larger and more precise datasets become available.
Should this anti-correlation be confirmed, as discussed in Paper I, this could indicate that high-multiplicity systems are a common outcome of the planetary formation process, but that a significant portion of these systems form or evolve into unstable orbital configurations.
References
- Laskar, J. 2000, Phys. Rev. Lett., 84, 3240 [NASA ADS] [CrossRef] [PubMed] [Google Scholar]
- Zinzi, A., & Turrini, D. 2017, A&A, 605, L4 [NASA ADS] [CrossRef] [EDP Sciences] [Google Scholar]
© ESO 2018
All Figures
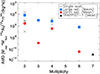 |
Fig. 1 Angular momentum deficit values of the systems considered. Crosses indicate values for the single systems, blue squares indicate average values for the “large selection” sample, red circles (with error bars smaller than the symbols) indicate averages values for “strict selection” sample. The value of TRAPPIST-1 value is shown as a black triangle. |
| In the text | |
Current usage metrics show cumulative count of Article Views (full-text article views including HTML views, PDF and ePub downloads, according to the available data) and Abstracts Views on Vision4Press platform.
Data correspond to usage on the plateform after 2015. The current usage metrics is available 48-96 hours after online publication and is updated daily on week days.
Initial download of the metrics may take a while.