Fig. 8.
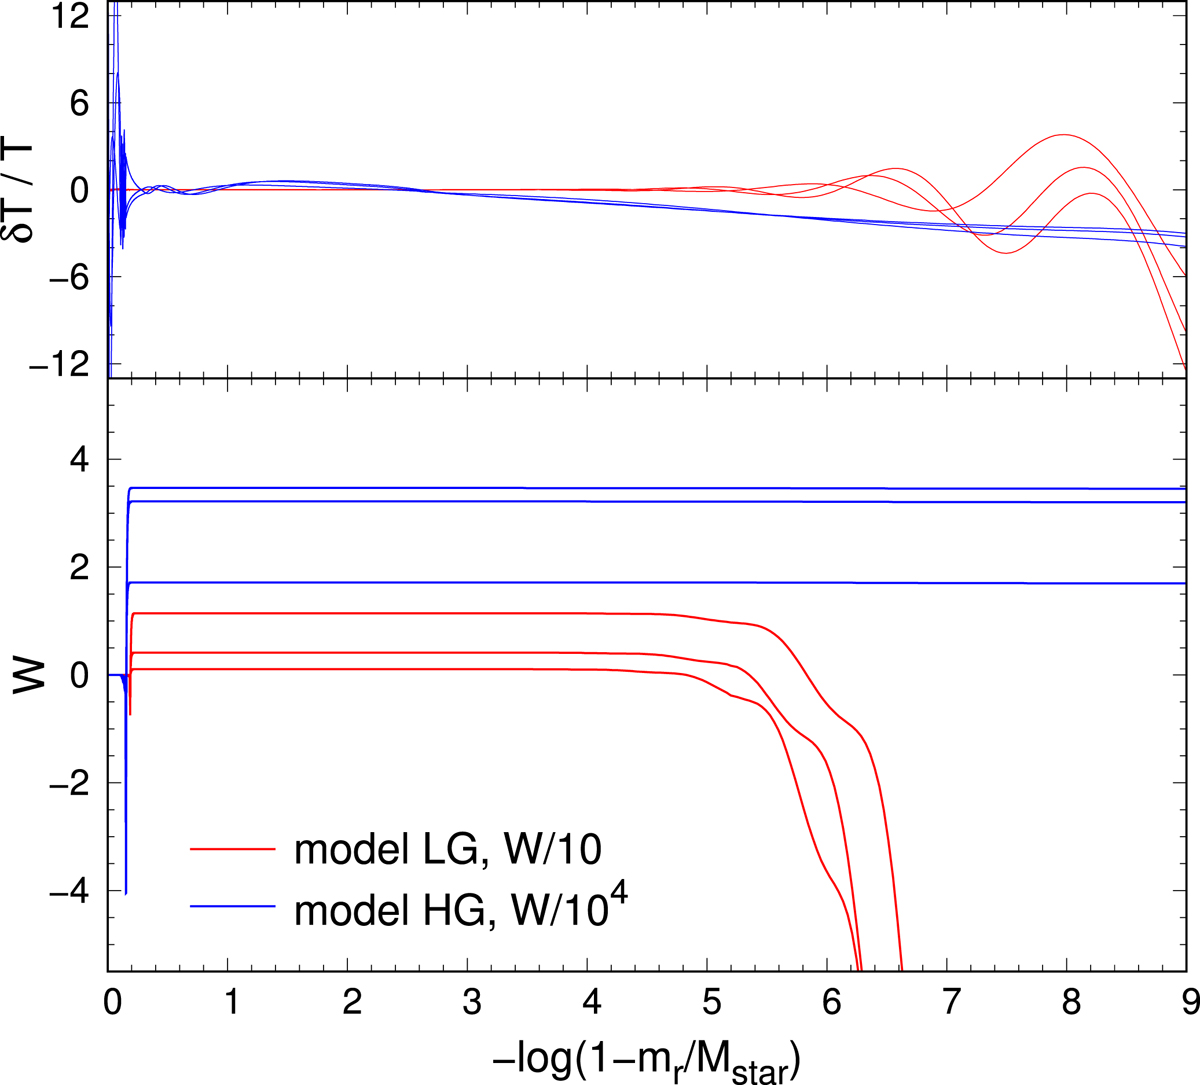
Upper panel: Lagrangian perturbation of the temperature for three modes of each of the models of Fig. 7. These modes have periods between 880–1130s and are excited by ∈ mechanism in the inner region (− log(1 − mr/M⋆) ~ 0.2). Blue (red) lines correspond to the modes of the model HG (LG). Lower panel: Running work integral for the same models is shown. The quantities W and δT/T are normalized to have the radius perturbation at the surface δr/R = 1. In the lower panel the running work integral is normalized arbitrarily for each model to be able to plot them in the same panel.
Current usage metrics show cumulative count of Article Views (full-text article views including HTML views, PDF and ePub downloads, according to the available data) and Abstracts Views on Vision4Press platform.
Data correspond to usage on the plateform after 2015. The current usage metrics is available 48-96 hours after online publication and is updated daily on week days.
Initial download of the metrics may take a while.