Fig. 7.
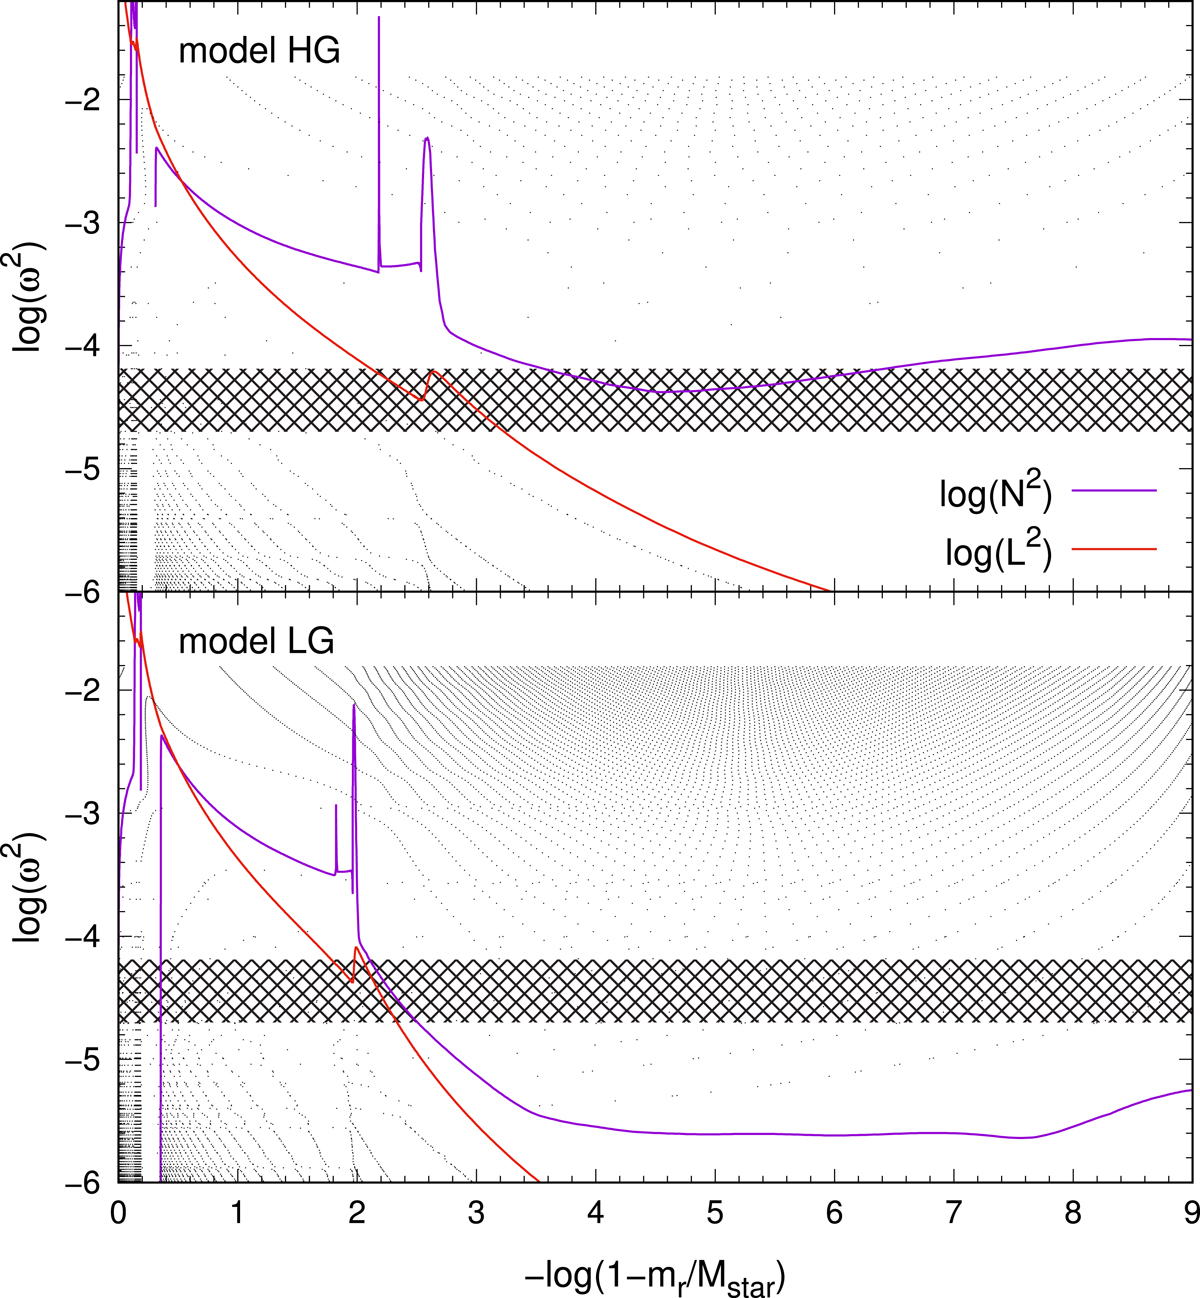
Logarithm of the squared Lamb and Brunt–Väisälä frequencies (violet and red lines) in terms of the outer mass fraction coordinate. The black points indicate the nodes of the radial eigenfunctions. The upper panel corresponds to a model with log g = 5.12, log Teff/K = 4.53, M⋆ = 0.4868 M⋆ (model HG) with excited modes. The lower panel corresponds to a model with log g = 4.25, log Teff/K = 4.35, M⋆ = 0.4908 M⊙ (model LG) and no excited modes. The region of periods in the range ~880–1130 s is shown with a green strip. This corresponds to the region of excited modes for model HG. At about log(1 − mr/M⋆) = −0.2 the Brunt–Väisälä frequency drops to zero in the convective zone. The pulsation driving region is located at the base of this convective zone.
Current usage metrics show cumulative count of Article Views (full-text article views including HTML views, PDF and ePub downloads, according to the available data) and Abstracts Views on Vision4Press platform.
Data correspond to usage on the plateform after 2015. The current usage metrics is available 48-96 hours after online publication and is updated daily on week days.
Initial download of the metrics may take a while.