Fig. 6.
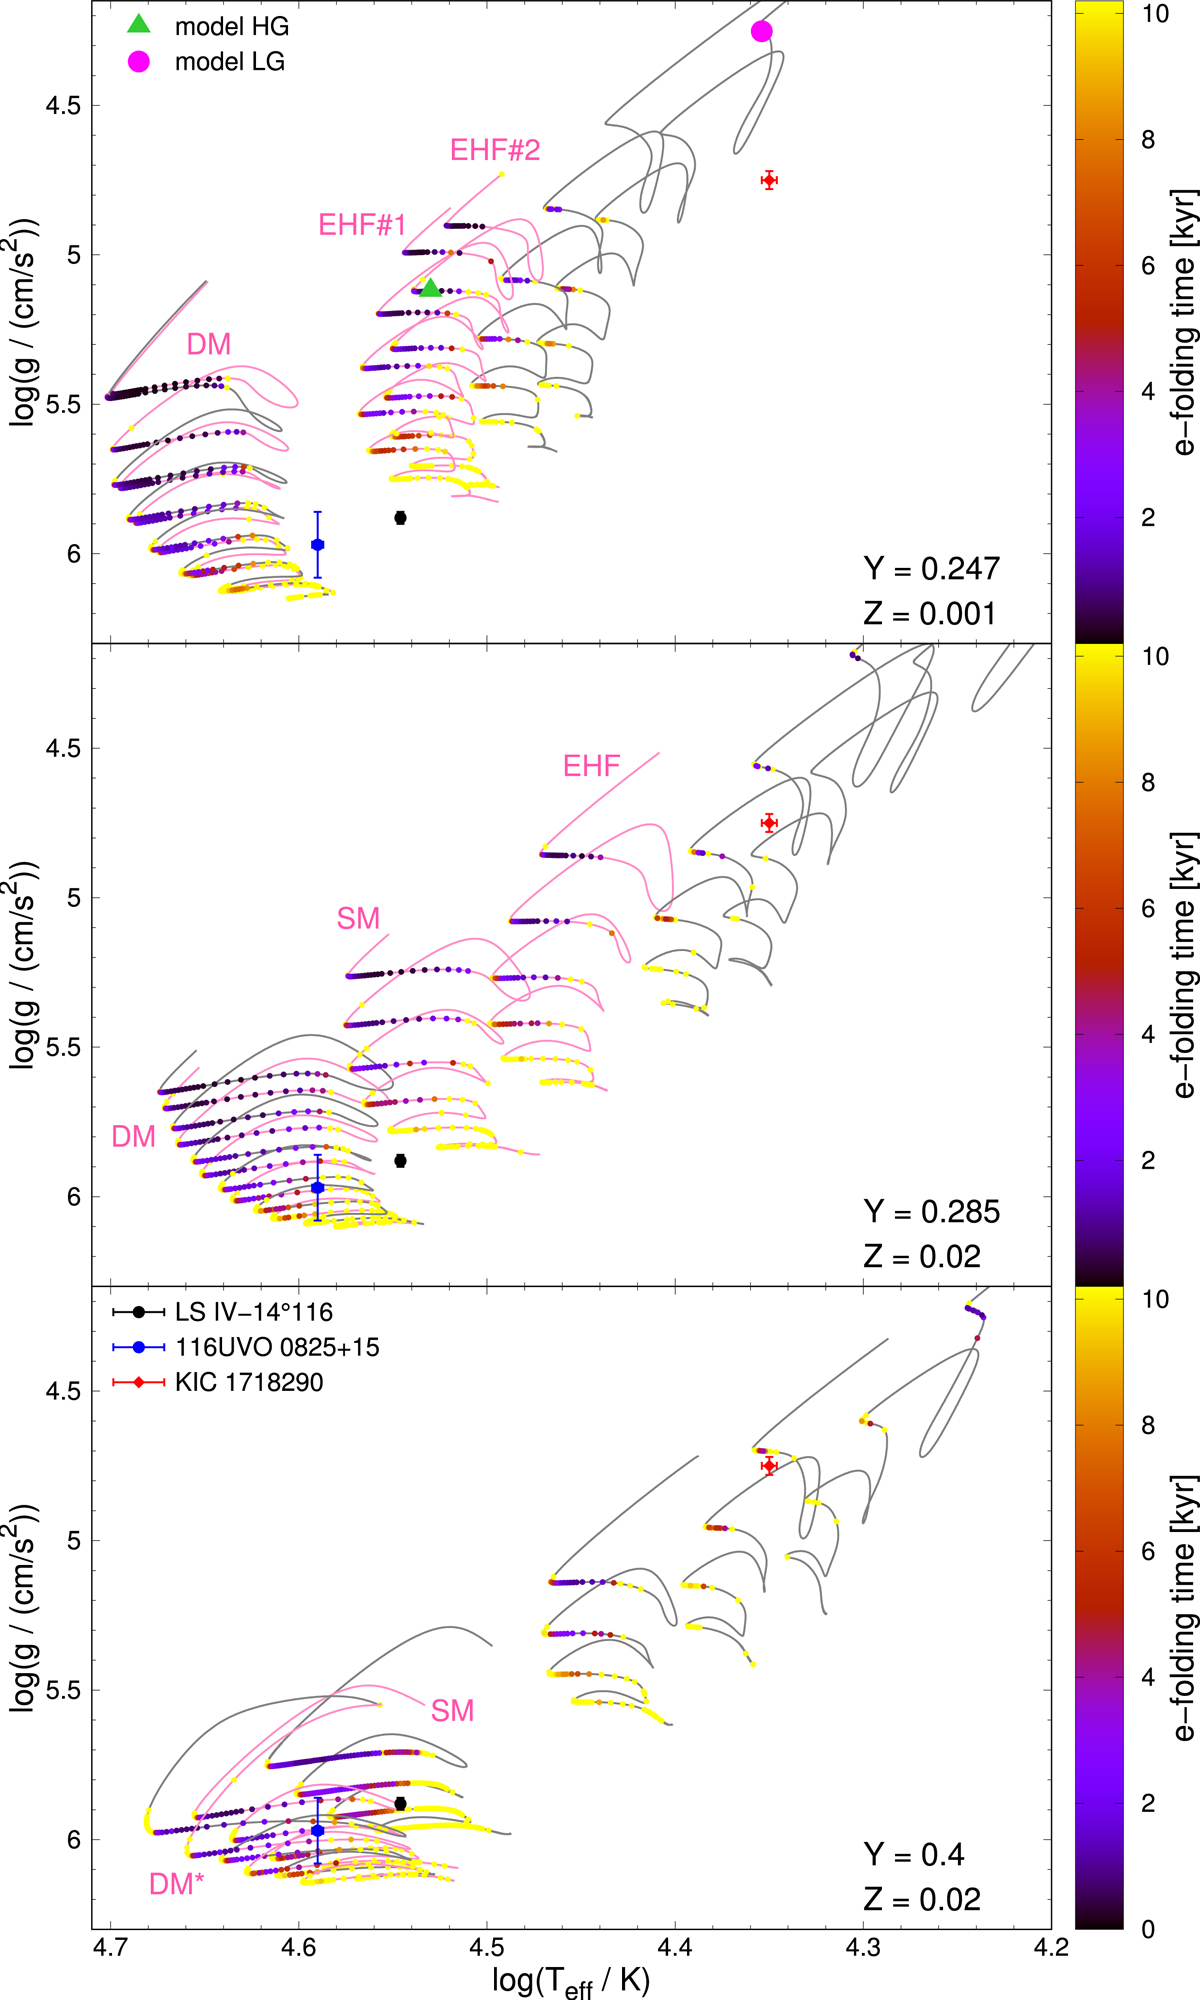
Phase of the He subflashes of the evolutionary sequences in the log Teff − log g diagram (grey and pink lines). Coloured points correspond to models with excited modes and the colour coding shows the minimum e-folding time for each model. Evolutionary sequences in pink lines have their pulsational quantities listed in Table 3. Also shown for comparison is the location of the known He-rich hot-subdwarf pulsators LS IV-14°116 (Randall et al. 2015), UVO 0825+15 (Jeffery et al. 2017), and KIC 1718290 (Østensen et al. 2012). The upper panel also shows the models discussed in Sect. 4.1.
Current usage metrics show cumulative count of Article Views (full-text article views including HTML views, PDF and ePub downloads, according to the available data) and Abstracts Views on Vision4Press platform.
Data correspond to usage on the plateform after 2015. The current usage metrics is available 48-96 hours after online publication and is updated daily on week days.
Initial download of the metrics may take a while.