Free Access
Fig. 1.
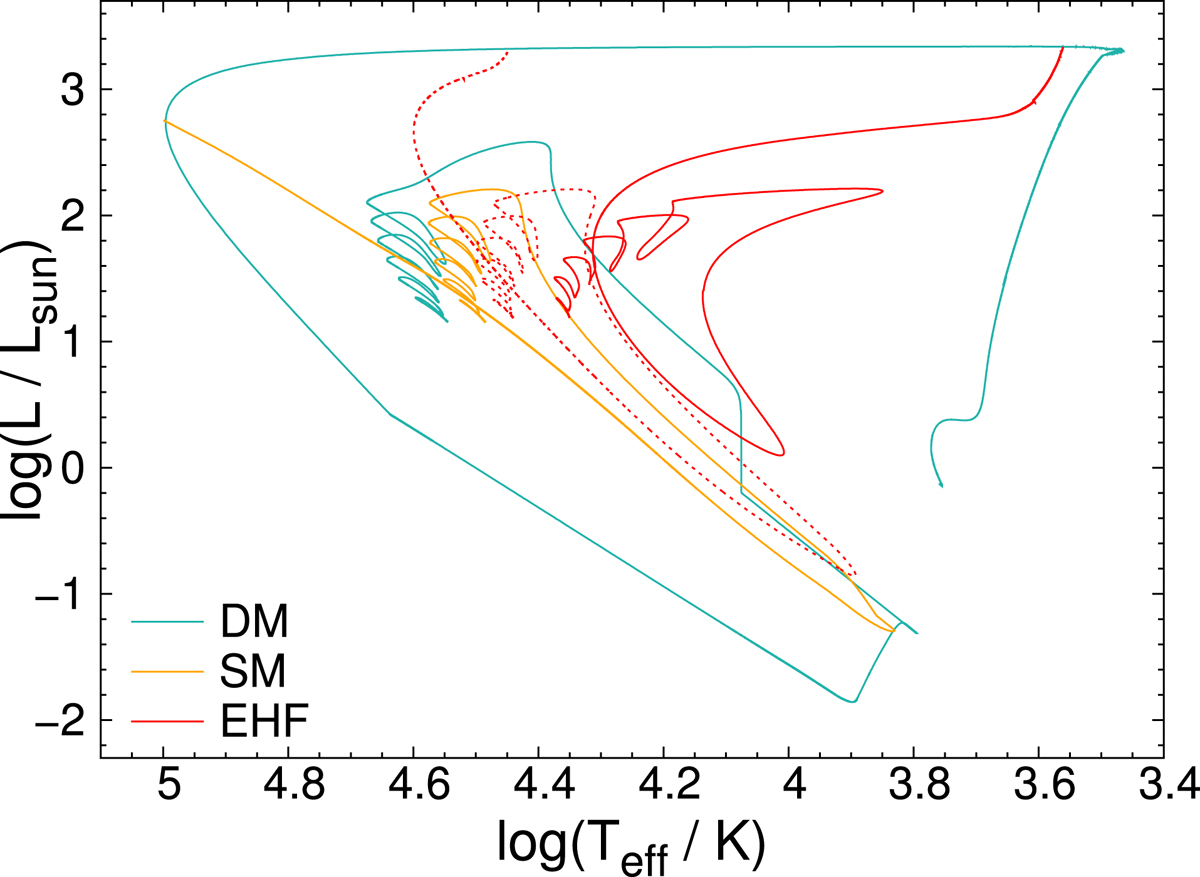
HR diagram for evolutionary sequences with Z = 0.02. The evolutionary sequences correspond to two cases of early hot flashers (EHF, dotted and full red lines) and two cases of late hot flashers: one with shallow mixing (SM; full yellow line) and the other with deep mixing (DM; full light blue line).
Current usage metrics show cumulative count of Article Views (full-text article views including HTML views, PDF and ePub downloads, according to the available data) and Abstracts Views on Vision4Press platform.
Data correspond to usage on the plateform after 2015. The current usage metrics is available 48-96 hours after online publication and is updated daily on week days.
Initial download of the metrics may take a while.