Free Access
Fig. 9
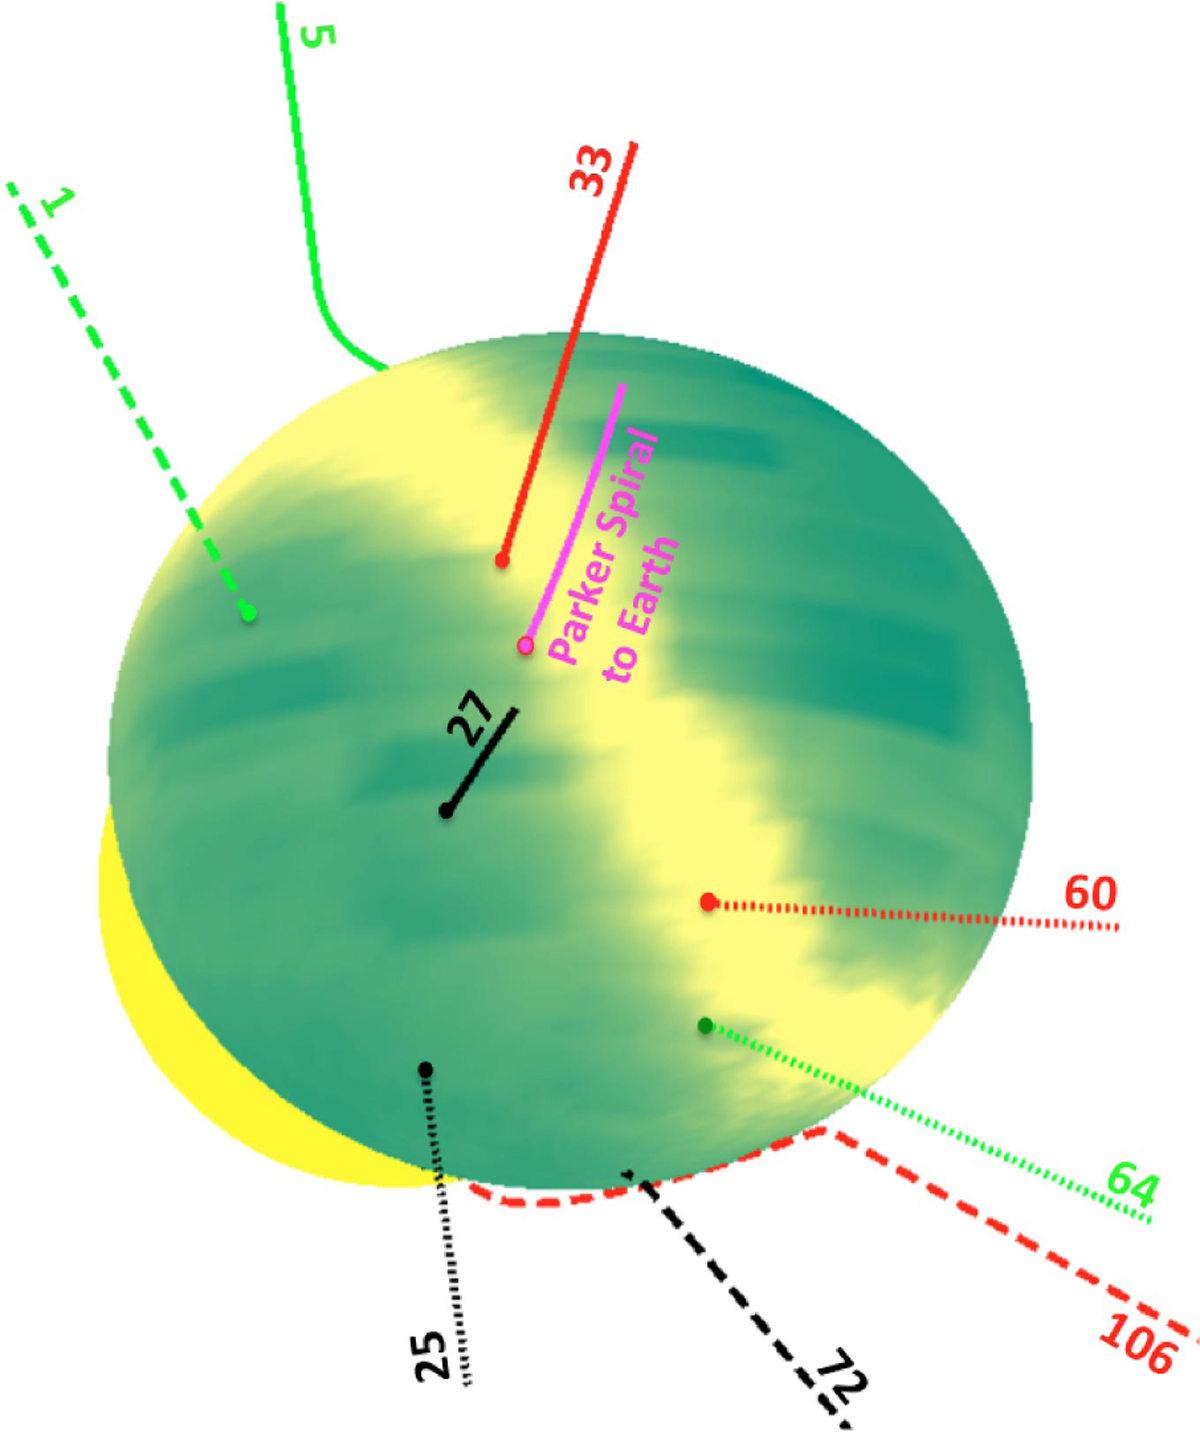
Distribution of the Mach number over the shock front at 01:45 UT (20 min after the flare onset) crossing the simulated magnetic field lines. We note the band (light yellow) of high values of the Mach number.
Current usage metrics show cumulative count of Article Views (full-text article views including HTML views, PDF and ePub downloads, according to the available data) and Abstracts Views on Vision4Press platform.
Data correspond to usage on the plateform after 2015. The current usage metrics is available 48-96 hours after online publication and is updated daily on week days.
Initial download of the metrics may take a while.