Fig. 5
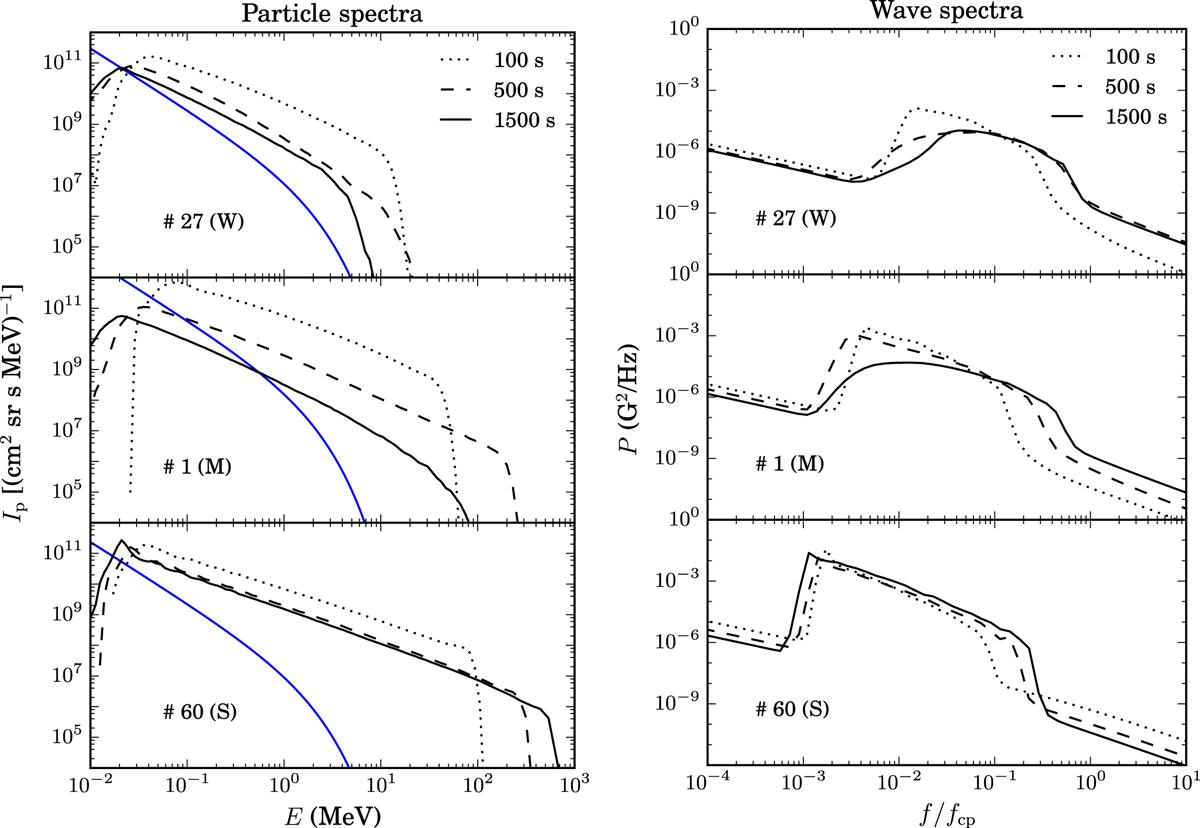
Left panel: simulated proton energy spectra at the shock at t = 100, 500, and 1500 s for three selected field lines. The blue line in each panel shows, for reference, the spectrum of protons constituting the seed-particle pool, Iseed (E) = p2fseed(p), at t = 100 s. Right panel: corresponding simulated Alfvén wave power spectra P(f) at the shock plotted against f∕fcp, where fcp is the proton cyclotron frequency.
Current usage metrics show cumulative count of Article Views (full-text article views including HTML views, PDF and ePub downloads, according to the available data) and Abstracts Views on Vision4Press platform.
Data correspond to usage on the plateform after 2015. The current usage metrics is available 48-96 hours after online publication and is updated daily on week days.
Initial download of the metrics may take a while.