Fig. 3
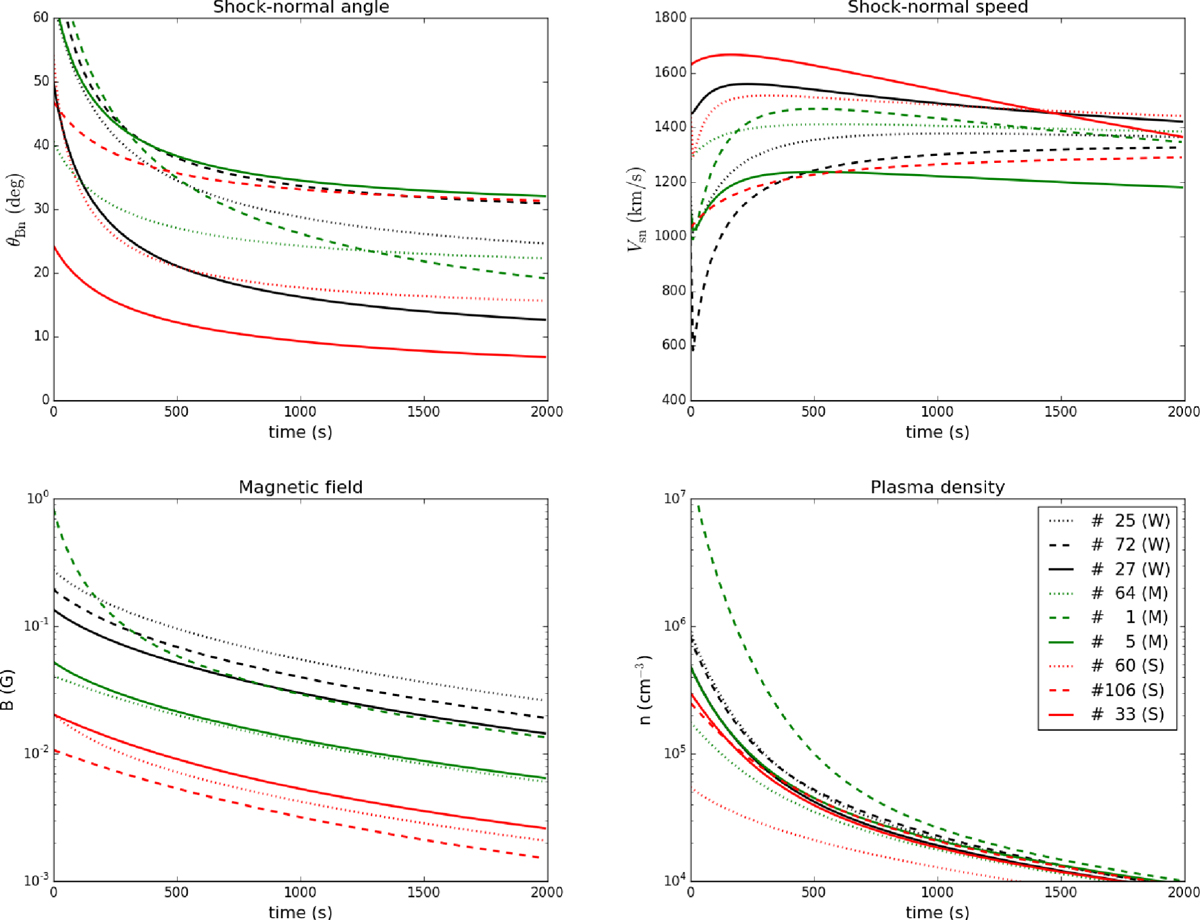
Shock and plasma parameters resulting from fitting the data for field lines selected for CSA simulations, plotted against simulation time. The upper panels show the shock-normal angle θBn and the shock-normal speed V sn; the bottom panels show the magnetic field magnitude B and the plasma density n. The legend gives the ID number and the group type of the simulated field lines.
Current usage metrics show cumulative count of Article Views (full-text article views including HTML views, PDF and ePub downloads, according to the available data) and Abstracts Views on Vision4Press platform.
Data correspond to usage on the plateform after 2015. The current usage metrics is available 48-96 hours after online publication and is updated daily on week days.
Initial download of the metrics may take a while.