Fig. 3
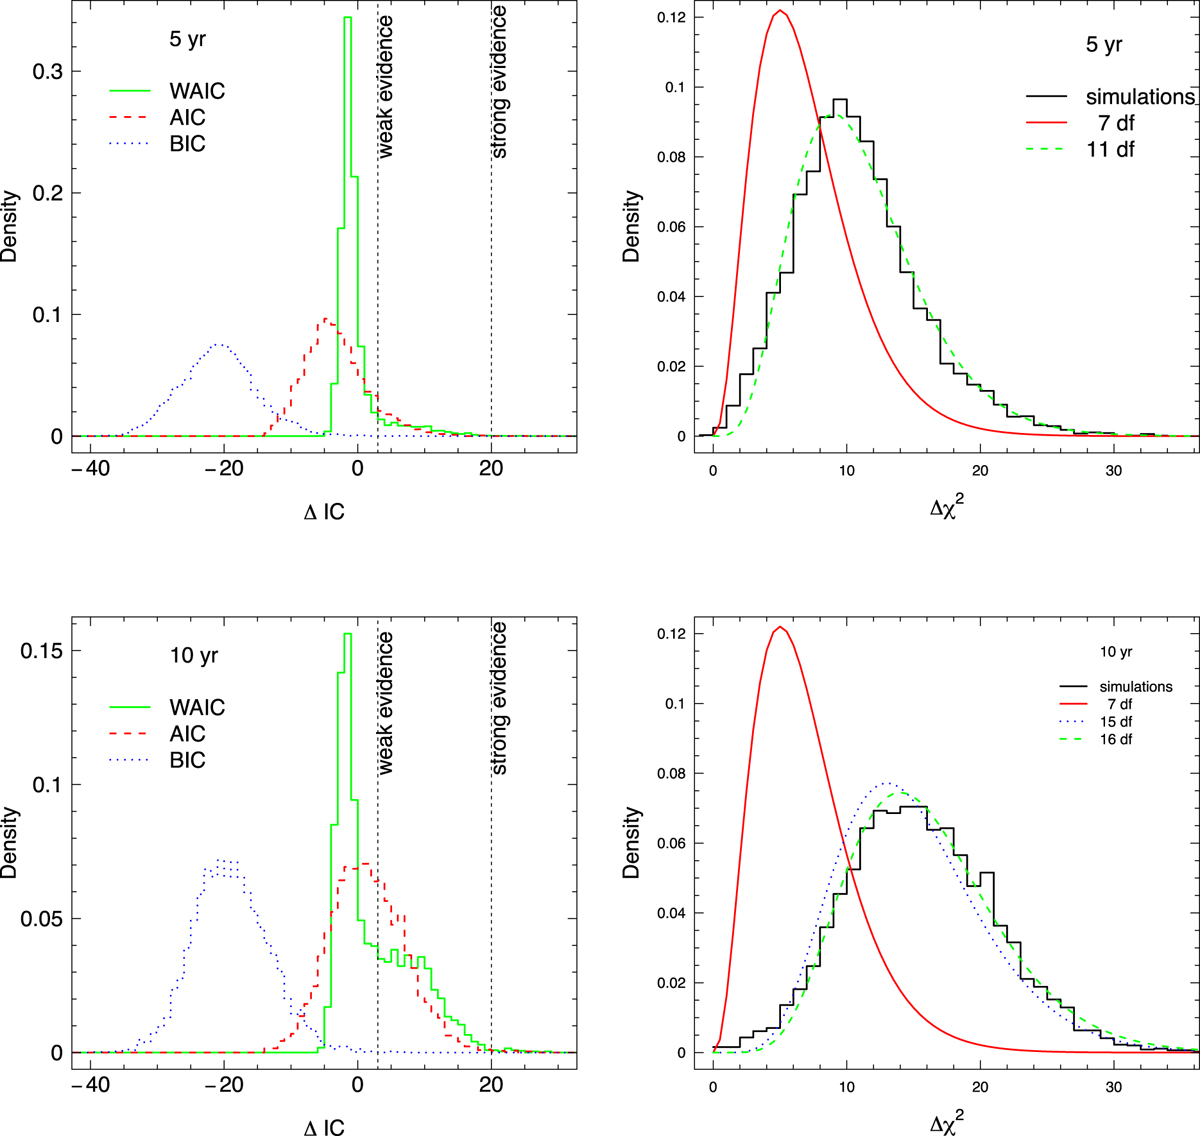
Histograms for the IC (left panels) and for Δχ2 (right panels) in the case of no-planet simulations. The upper panels consider the 5 yr mission, the lower panels the 10 yr mission. Leftpanels: green solid lines, WAIC; red dashed lines, AIC; blue dotted lines, BIC; the vertical dashed lines show the IC thresholds for weak and strong evidence according to Jeffreys’ scale. Right panels: solid and dashed curves show χ2 distributions with the dof reported in the legend. The empirical density does not follow a χ2 distribution with the nominal number of dof (7, solid red line). It can however be approximated, by a χ2 distribution with a larger number of dof: 11 dof for the 5 yr mission, 15 dof (or 16 dof for Δ χ2 ≳ 30) for the 10 yr mission.
Current usage metrics show cumulative count of Article Views (full-text article views including HTML views, PDF and ePub downloads, according to the available data) and Abstracts Views on Vision4Press platform.
Data correspond to usage on the plateform after 2015. The current usage metrics is available 48-96 hours after online publication and is updated daily on week days.
Initial download of the metrics may take a while.