Fig. 11
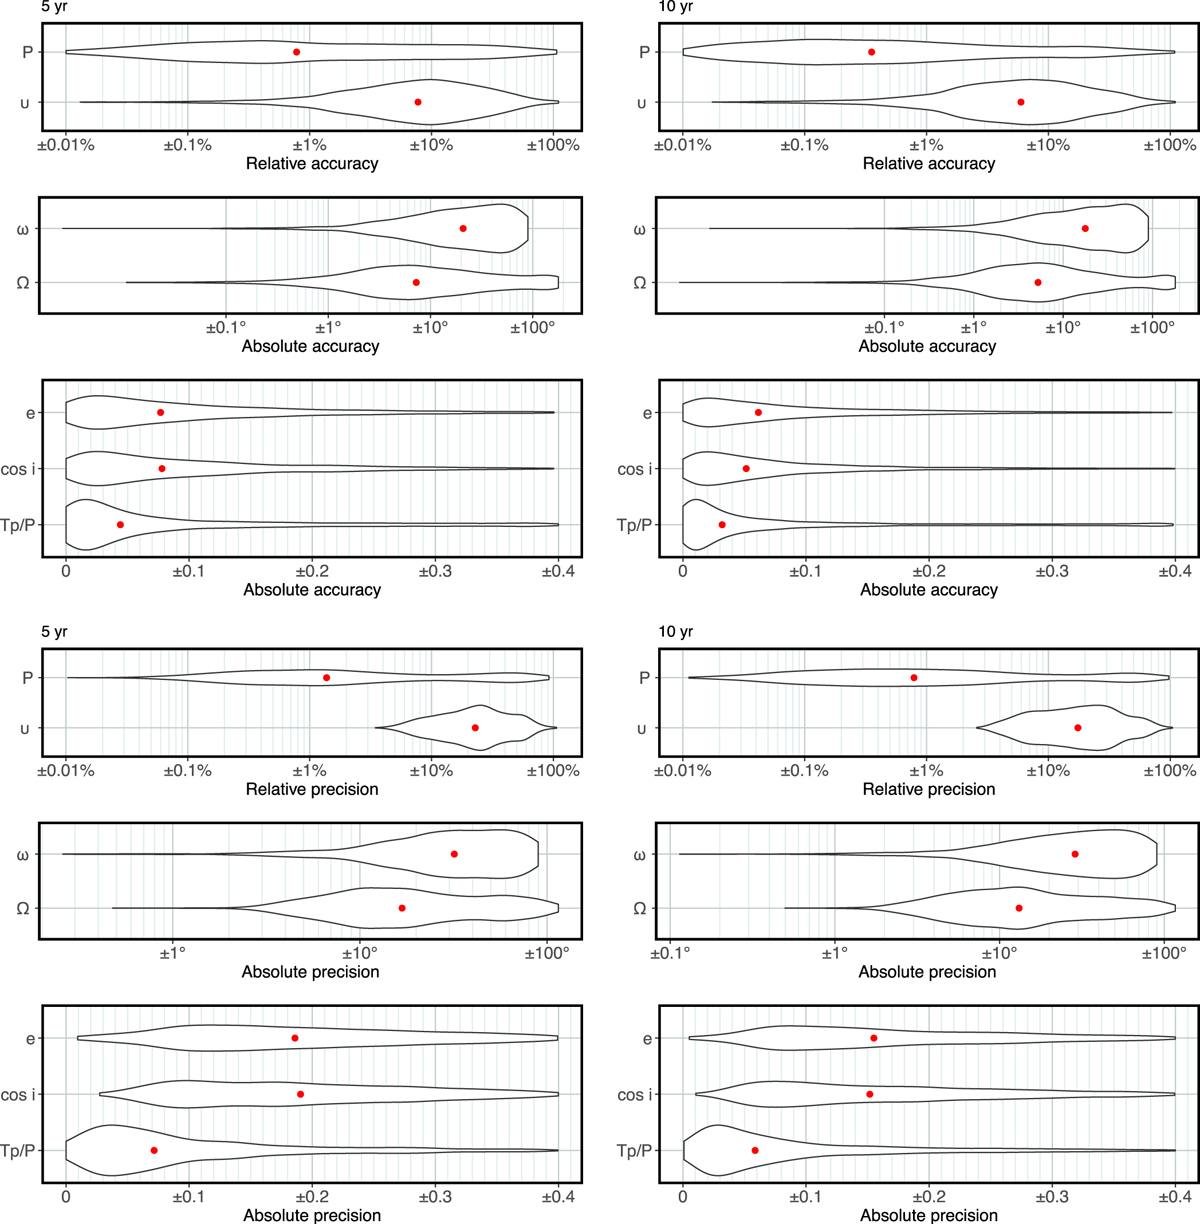
Accuracy and precision of the fit parameters. Left panels: 5 yr mission; right panels: 10 yr mission. For each orbital parameter, the accuracy is the absolute difference between the input value and the median of the output posterior distribution. The precision is the length of the 68.3% highest posterior density interval (HPDI). The figures depicted by the black curves show the distribution of either accuracy or precision; they have normalised areas, so that at every value of the abscissa, their height is proportional to the density of the distribution. The red dots mark the median of each distribution. Relative quantities are shown for quantities that vary over several orders of magnitude, namely P and υ; absolute quantities for the remaining parameters. We consider Tp∕P (instead of just Tp) because it is always contained in the [0, 1] interval; thus, Tp has a median precision of 5% P in the 5 yr mission.
Current usage metrics show cumulative count of Article Views (full-text article views including HTML views, PDF and ePub downloads, according to the available data) and Abstracts Views on Vision4Press platform.
Data correspond to usage on the plateform after 2015. The current usage metrics is available 48-96 hours after online publication and is updated daily on week days.
Initial download of the metrics may take a while.