Fig. 4
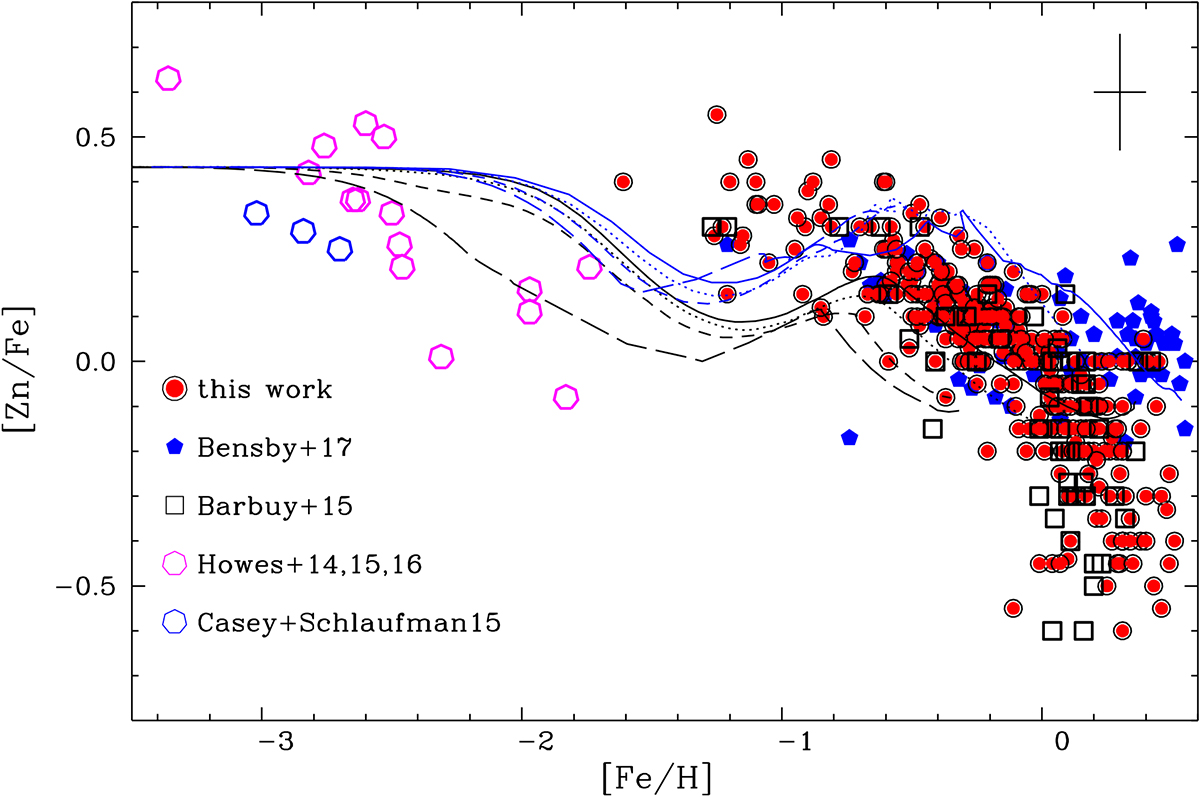
[Zn/Fe] vs. [Fe/H] for the present sample (333 stars), compared with literature. Symbols: red filled circles: present work; black squares: results for stars in common based on UVES data (Barbuy et al. 2015); blue filled pentagons: Bensby et al. (2017); magenta open heptagons: Howes et al. (2015, 2016); blue open heptagons: Casey & Schlaufman (2015). Chemodynamical evolution models by FB17 with formation timescale of 2 (black lines) and 3 Gyr (blue lines), or specific star formation rate of 0.5, 0.3 Gyr−1 are overplotted. The model lines correspond to different radii from the Galactic centre: solid lines: r < 0.5 kpc; dotted lines: 0.5 < r < 1 kpc; dashed lines: 1 < r < 2 kpc; long-dashed lines: 2 < r < 3 kpc. A typical error bar is indicated in the right upper corner, corresponding to a mean between the two reference stars (Table 4).
Current usage metrics show cumulative count of Article Views (full-text article views including HTML views, PDF and ePub downloads, according to the available data) and Abstracts Views on Vision4Press platform.
Data correspond to usage on the plateform after 2015. The current usage metrics is available 48-96 hours after online publication and is updated daily on week days.
Initial download of the metrics may take a while.