Fig. 9
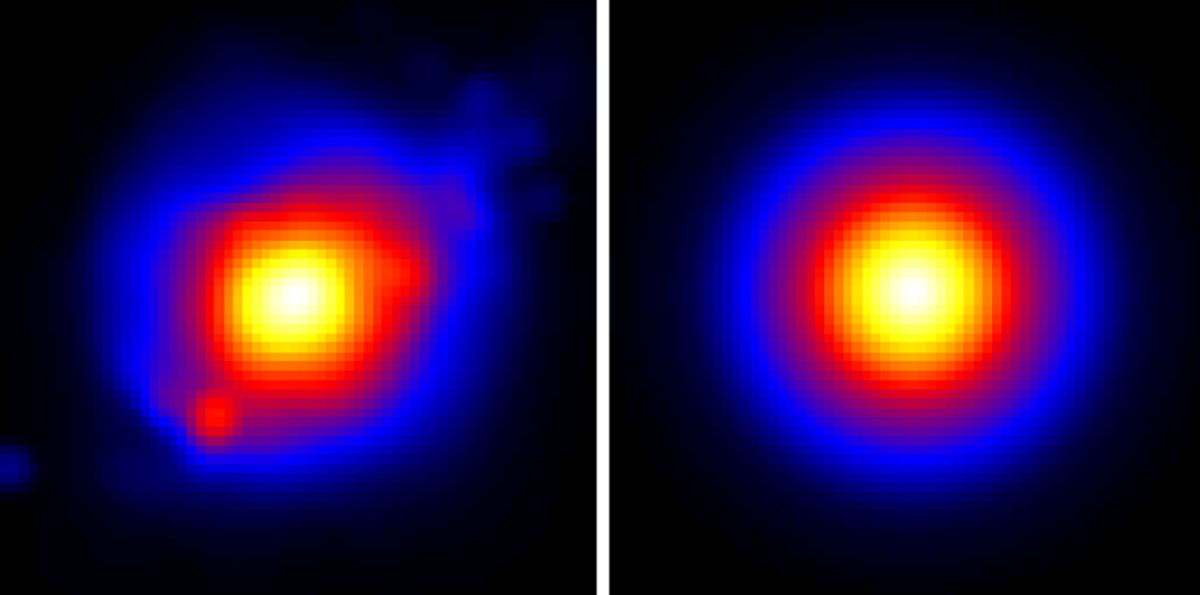
Maps illustrating the result of the R–L deprojection algorithm on a set of 100 simulated maps of the X-ray emission of the g1-cluster assuming spherical symmetry. Left: mean map obtained by averaging the 100 simulated X-ray maps of the g1-cluster; right: mean map resulting from the average of the 100 maps obtained after applying the R–L de- and reprojection. Both maps are dimensionless, have the same color scale (ranging from 2e–5 to 8.30e–3, from dark blue to light yellow), and are shown in logarithmic scale.
Current usage metrics show cumulative count of Article Views (full-text article views including HTML views, PDF and ePub downloads, according to the available data) and Abstracts Views on Vision4Press platform.
Data correspond to usage on the plateform after 2015. The current usage metrics is available 48-96 hours after online publication and is updated daily on week days.
Initial download of the metrics may take a while.