Fig. 8
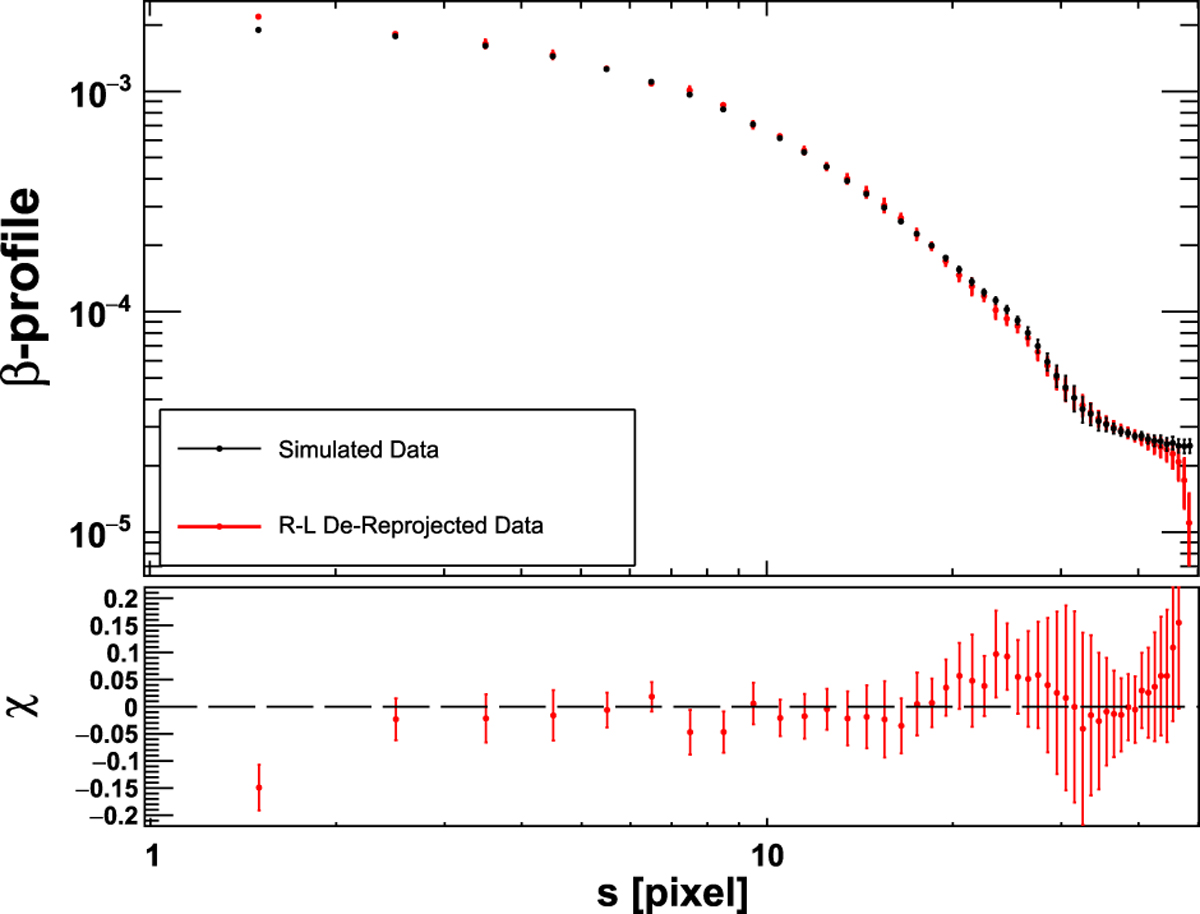
Top: normalized profiles illustrating the results of the de- and reprojection of the simulated β-profile map rebinned using the Voronoi tessellation with 300 counts/bin. Black: profile of the rebinned initial data maps; Red: profile obtained by de- and reprojecting the initial data maps. These profiles correspond to the azimuthal average of the maps on the left and on the right of Fig. 7, respectively. Bottom: relative residuals computed as in Fig. 3.
Current usage metrics show cumulative count of Article Views (full-text article views including HTML views, PDF and ePub downloads, according to the available data) and Abstracts Views on Vision4Press platform.
Data correspond to usage on the plateform after 2015. The current usage metrics is available 48-96 hours after online publication and is updated daily on week days.
Initial download of the metrics may take a while.