Free Access
Fig. 4
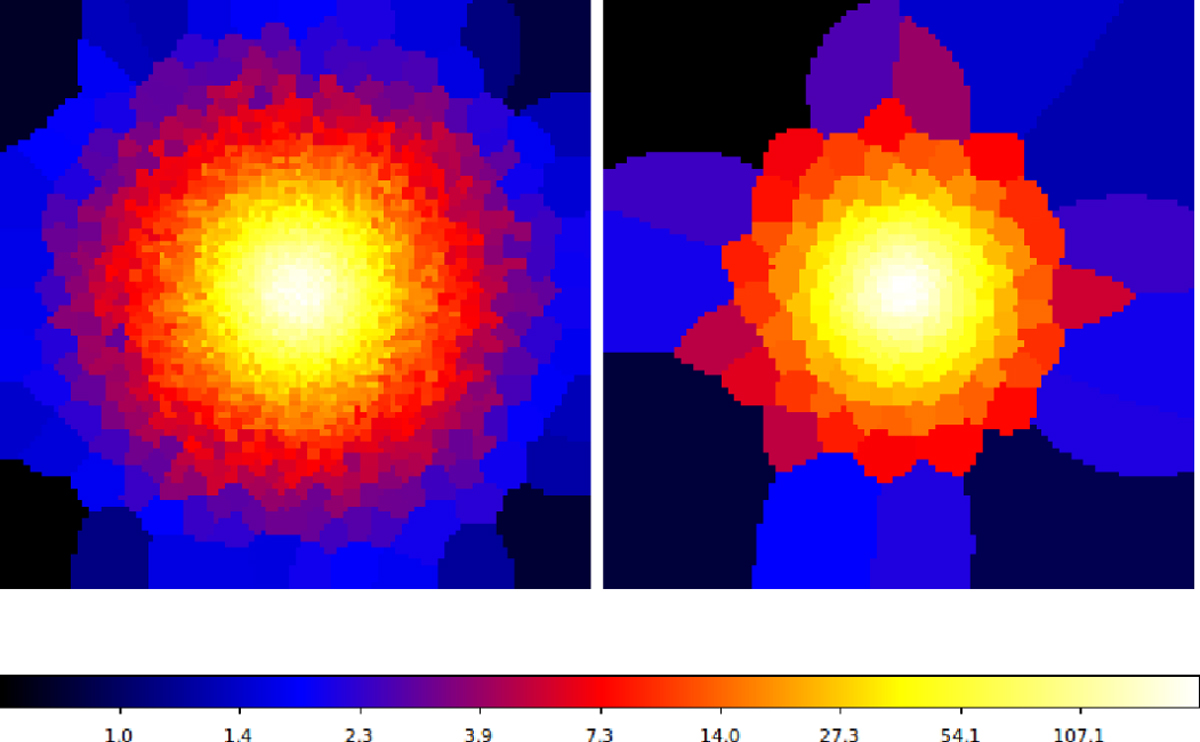
Maps illustrating the binning with Voronoi tessellation with 30 counts/bin (left) and 300 counts/bin (right) of one noisy β-profile map (in logarithmic scale). Both maps were created with the code of Eckert et al. (2015).
Current usage metrics show cumulative count of Article Views (full-text article views including HTML views, PDF and ePub downloads, according to the available data) and Abstracts Views on Vision4Press platform.
Data correspond to usage on the plateform after 2015. The current usage metrics is available 48-96 hours after online publication and is updated daily on week days.
Initial download of the metrics may take a while.