Fig. 21
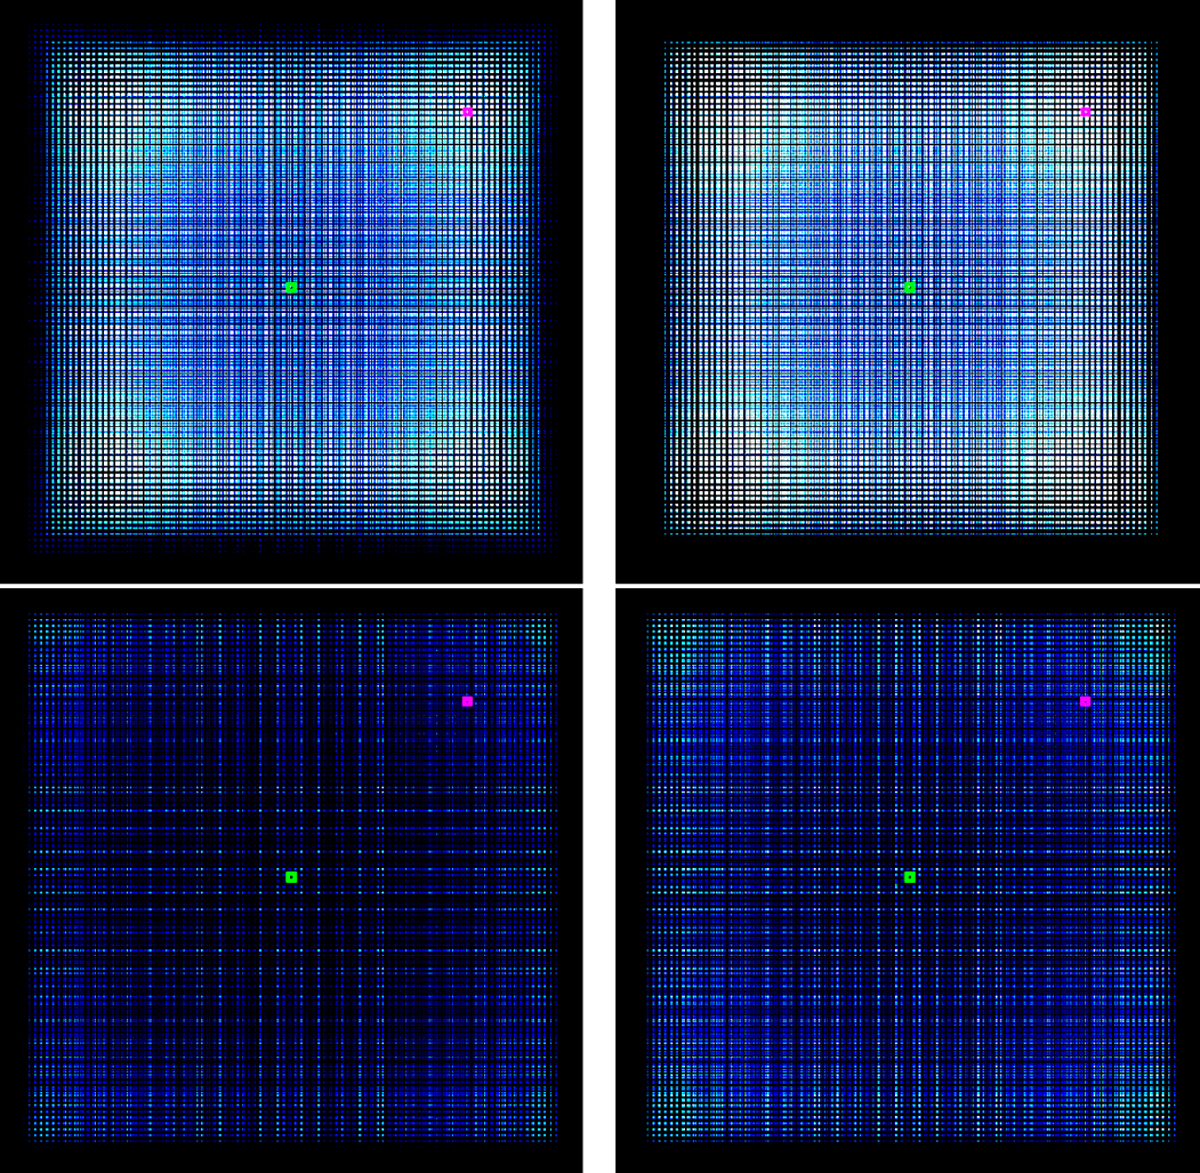
Covariance matrices of the projected gravitational potential of the cluster Abell 2142 reconstructed from its X-ray observations (Sect. 5), computed with Eq. (15). An illustration of a reconstructed potential is shown in Fig. 20, with two selected lines of cells: one in magenta, and one in green. The information on the variance in these lines is contained in the diagonal entries of the block matrices with the matching color in the present figure and in Figs. 22 and 23. The results for the HGR are shown in the top panels. Left: smoothing parameter fixed to L = 1; right: smoothing parameter linearly increasing from L = 1 to L = 10. LRG results are shown on the bottom panels. Left: smoothing parameter fixed at L = 0.2; right: smoothing parameter linearly increasing from L = 0.2 to L = 2. The same color scale has been used for the four panels, which runs from 0 (in black) to 0.004 (in white).
Current usage metrics show cumulative count of Article Views (full-text article views including HTML views, PDF and ePub downloads, according to the available data) and Abstracts Views on Vision4Press platform.
Data correspond to usage on the plateform after 2015. The current usage metrics is available 48-96 hours after online publication and is updated daily on week days.
Initial download of the metrics may take a while.