Fig. 14
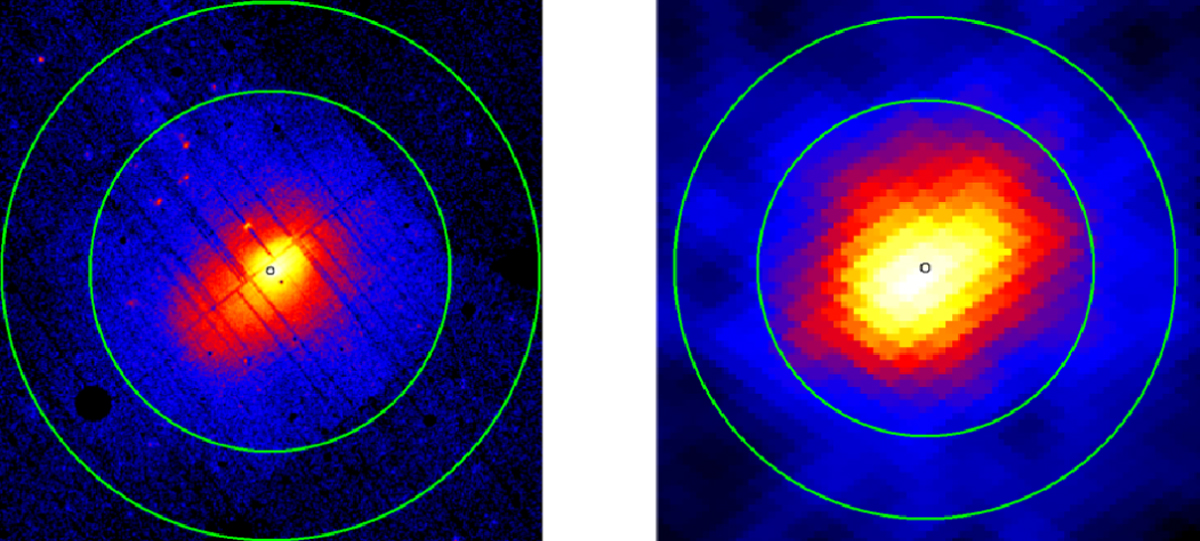
Regions of the observations of Abell 2142 used in this analysis. Left: XMM-Newton X-ray data in counts (ranging from 0, in black; to 120 counts, in white), taken within the X-COP program (Eckert et al. 2017) (in logarithmic scale); right: Planck SZ data in units of the Compton-y parameter (ranging from 8.5e–7, in black; to 6.6e–5 counts, in white), using the method of Hurier et al. (2013). The black circle represents the position of the image center used in our analysis, while the two green circles outline R500 and R200.
Current usage metrics show cumulative count of Article Views (full-text article views including HTML views, PDF and ePub downloads, according to the available data) and Abstracts Views on Vision4Press platform.
Data correspond to usage on the plateform after 2015. The current usage metrics is available 48-96 hours after online publication and is updated daily on week days.
Initial download of the metrics may take a while.