Fig. 13
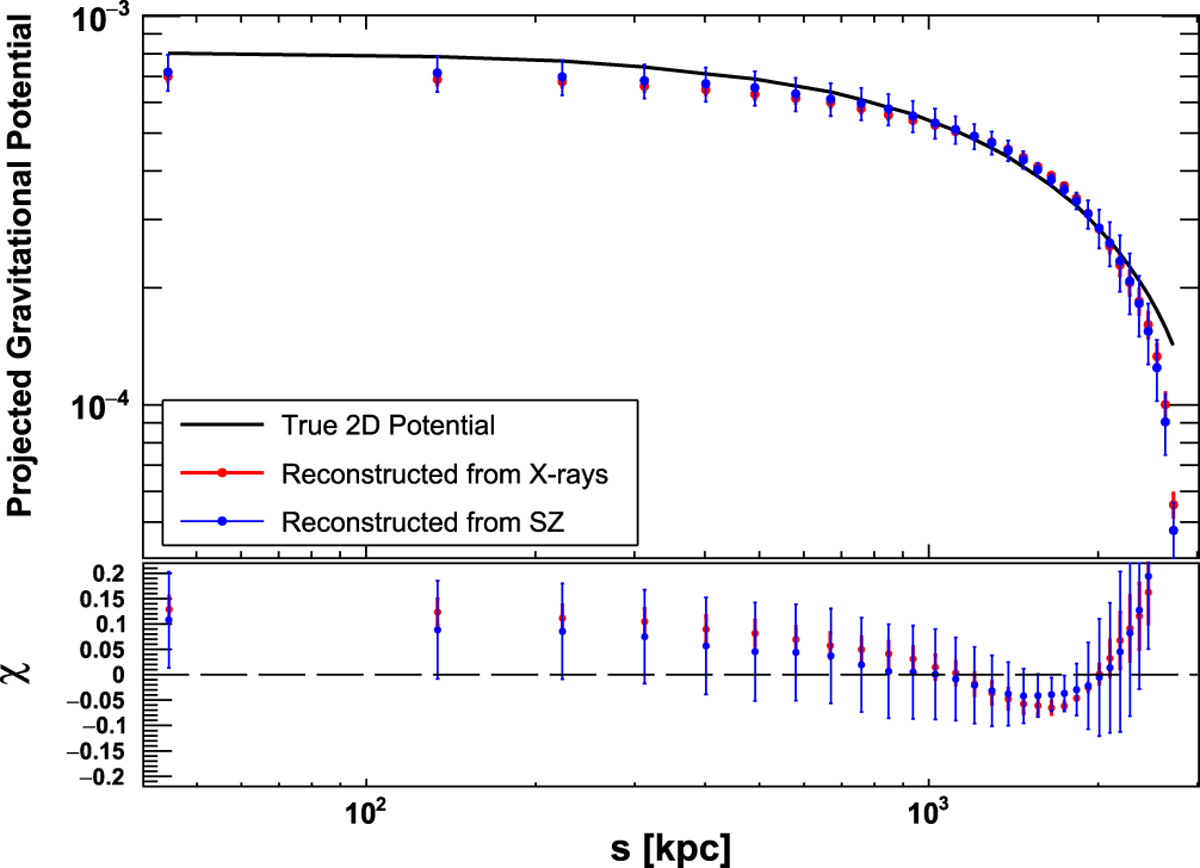
Top: normalized azimuthally averaged projected gravitational potential reconstructed from the X-ray (Eq. (9)) and from the SZ signal (Eq. (12)) of the g1-cluster, compared to the true projected potential. Blue: projected potential reconstructed from the SZ signal; Red: projected potential reconstructed from the X-ray signal; black: true projected potential. Bottom: relative residuals computed as (ftrue (s) − fRecons(s))∕ftrue(s), with the corresponding uncertainties obtained with error propagation and no uncertainties on ftrue (s).
Current usage metrics show cumulative count of Article Views (full-text article views including HTML views, PDF and ePub downloads, according to the available data) and Abstracts Views on Vision4Press platform.
Data correspond to usage on the plateform after 2015. The current usage metrics is available 48-96 hours after online publication and is updated daily on week days.
Initial download of the metrics may take a while.