| Issue |
A&A
Volume 613, May 2018
|
|
|---|---|---|
| Article Number | L6 | |
| Number of page(s) | 11 | |
| Section | Letters to the Editor | |
| DOI | https://doi.org/10.1051/0004-6361/201832740 | |
| Published online | 25 May 2018 | |
Letter to the Editor
New disk discovered with VLT/SPHERE around the M star GSC 07396−00759★
1
INAF-Osservatorio Astronomico di Padova,
Vicolo dell’Osservatorio 5,
35122
Padova,
Italy
e-mail: elena.sissa@oapd.inaf.it
2
Max Planck Institut für Astronomie,
Königstuhl 17,
69117
Heidelberg, Germany
3
Instituto de Física y Astronomía, Facultad de Ciencias, Universidad de Valparaíso,
Av. Gran Bretaña 1111, Playa Ancha,
Valparaíso, Chile
4
Núcleo Milenio Formación Planetaria – NPF, Universidad de Valparaíso,
Av. Gran Bretaña 1111,
Valparaíso, Chile
5
Aix-Marseille Université, CNRS, LAM (Laboratoire d’Astrophysique de Marseille) UMR 7326,
13388
Marseille, France
6
Université Grenoble Alpes, CNRS, IPAG,
38000
Grenoble, France
7
CRAL, UMR 5574, CNRS, Université de Lyon, École Normale Supérieure de Lyon,
46 Allée d’Italie,
69364
Lyon Cedex 07, France
8
LESIA, Observatoire de Paris-Meudon, CNRS, Université Pierre et Marie Curie, Université Paris Diderot,
5 place Jules Janssen,
92195
Meudon, France
9
Institute of Astronomy, University of Cambridge,
Madingley Road,
Cambridge
CB3 0HA, UK
10
Dipartimento di Fisica e Astronomia – Universita’ di Padova,
Vicolo dell’Osservatorio 3,
35122
Padova, Italy
11
INCT, Universidad De Atacama,
calle Copayapu 485, Copiapó,
Atacama, Chile
12
INAF-Osservatorio Astrofisico di Catania,
Via S. Sofia 78,
95123
Catania, Italy
13
Núcleo de Astronomía, Facultad de Ingeniería, Universidad Diego Portales,
Av. Ejercito 441,
Santiago, Chile
14
Departamento de Astronomía, Universidad de Chile,
Casilla 36-D,
Santiago, Chile
15
Department of Astronomy, Stockholm University, AlbaNova University Center,
106 91
Stockholm, Sweden
16
Exoplanets and Stellar Astrophysics Laboratory, Code 667, NASA Goddard Space Flight Center,
Greenbelt,
MD
20770, USA
17
Institute for Particle Physics and Astrophysics, ETH Zurich,
Wolfgang-Pauli-Strasse 27,
8093
Zurich, Switzerland
18
Center for Theoretical Astrophysics and Cosmology, Institute for Computational Science, University of Zürich,
Winterthurestrasse 190,
8057
Zürich, Switzerland
19
Anton Pannekoek Institute for Astronomy,
Science Park 904,
1098 XH
Amsterdam, The Netherlands
Received:
31
January
2018
Accepted:
26
February
2018
Debris disks are usually detected through the infrared excess over the photospheric level of their host star. The most favorable stars for disk detection are those with spectral types between A and K, while the statistics for debris disks detected around low-mass M-type stars is very low, either because they are rare or because they are more difficult to detect. Terrestrial planets, on the other hand, may be common around M-type stars. Here, we report on the discovery of an extended (likely) debris disk around the M-dwarf GSC 07396−00759. The star is a wide companion of the close accreting binary V4046 Sgr. The system probably is a member of the β Pictoris Moving Group. We resolve the disk in scattered light, exploiting high-contrast, high-resolution imagery with the two near-infrared subsystems of the VLT/SPHERE instrument, operating in the Y J bands and the H2H3 doublet. The disk is clearly detected up to 1.5′′ (~110 au) from the star and appears as a ring, with an inclination i ~ 83°, and a peak density position at ~70 au. The spatial extension of the disk suggests that the dust dynamics is affected by a strong stellar wind, showing similarities with the AU Mic system that has also been resolved with SPHERE. The images show faint asymmetric structures at the widest separation in the northwest side. We also set an upper limit for the presence of giant planets to 2 MJ. Finally, we note that the 2 resolved disks around M-type stars of 30 such stars observed with SPHERE are viewed close to edge-on, suggesting that a significant population of debris disks around M dwarfs could remain undetected because of an unfavorable orientation.
Key words: stars: individual: GSC 07396–00759 / techniques: high angular resolution / protoplanetary disks
© ESO 2018
1 Introduction
Circumstellar disks are commonly detected around young stars both by ground- and space-based telescopes in a wide portion of the spectrum (see, e.g., Moro Martin 2013; Krivov 2010; Matthews et al. 2014), from scattered light and near-infrared wavelengths with facilities such as the Hubble Space Telescope or Spitzer, to mid- and far-infrared wavelengths with facilities such as Herschel, and up to submillimeter wavelengths for radio-telescopes such as ALMA. Primordial circumstellar disks around M dwarfs have been shown to typically have longer lifetimes than those around more massive stars (Carpenter et al. 2006; Luhman & Mamajek 2012). However, many surveys found that their evolved counterparts, the debris disks, are quite rare (Plavchan et al. 2005; Lestrade et al. 2006, 2009; Gautier et al. 2007; Avenhaus et al. 2012). Up to now, very few low-mass M-type stars older than 15–20 Myr show excesses, especially in the near- and mid-infrared, and even fewer dwarfs have resolved images of disks: the AU Mic disk was first detected in scattered light with high-contrast imaging (Kalas et al. 2004), whereas GJ 581 (Lestrade et al. 2012), and possibly Proxima Cen (Anglada et al. 2017; MacGregor et al. 2018) were imaged in direct thermal emission with Herschel and ALMA, respectively1. Several of these disks have peculiar features, such as multiple rings, spirals (Anglada et al. 2017; Olofsson et al. 2018), and fast-moving arc-like structures (Boccaletti et al. 2015, 2018).
The paucity of debris disk detections around low-mass M-type stars may have two main reasons: disks around such stars are in fact less common and/or they are more difficult to detect. On one hand, the formation of planetesimals may be strongly inhibited both by external photoevaporation due to intense far-UV radiation field that typically influences these objects (Adams et al. 2004) and to close stellar flybys (Lestrade et al. 2011). On the other hand, M-type stars are very cool objects and thus they are less luminous than stars of earlier type. This implies that dust particles are less heated and faintly emit at long wavelengths, making these excesses hard to detect with current instrumentation.
Debris disks around young M stars are also relevant to explore the possible link between their occurrence and the presence of terrestrial planets in the system (Raymond et al. 2011), which are very frequent around low-mass stars (Bonfils et al. 2013; Dressing & Charbonneau 2015). The presence of planetary systems around both GJ 581 and Proxima (Mayor et al. 2009; Anglada-Escudé et al. 2016) is very promising in this perspective.
For these reasons, the detection of spatially resolved disks around low-mass M-type stars is of high interest. We present the newly imaged GSC 07396−00759 likely debris disk with the instrument SPHERE (Spectro-Polarimetric High-contrast Exoplanet REsearch; Beuzit et al. 2008). GSC 07396−00759 is a very active but not accreting M1-type star associated with V4046 Sgr (Torres et al. 2006; Kastner et al. 2011), which is itself a close binary with accretion signature (Stempels & Gahm 2004) and a gas-rich circumbinary disk (Rosenfeld et al. 2013). The two systems are probably members of the β Pictoris Moving Group (β Pic MG, 24 ± 3 Myr, Torres et al. 2006; Malo et al. 2014). More details on the stellar properties can be found in Appendix A.
2 Observations and results
We observed GSC 07396−00759 during the SPHERE Guaranteed Time Observation as part of the SpHere INfrared survey for Exoplanets (SHINE), in the night of June 15, 2017. The sky conditions were very good, with an average coherence time longer than 10 ms and an average Strehl ratio of ~65%, which is excellent considering the faintness of the source (R = 12.01, Zacharias et al. 2017). This target was observed in the standard IRDIFS mode, using IFS (Claudi et al. 2008) in the Y J bands (between 0.95 and 1.35 μm, 1.7′′ × 1.7′′ field of view; FoV) and IRDIS (Dohlen et al. 2008) in dual-band imaging H2H3 mode (at 1.59 and 1.67 μm Vigan et al. 2010, 11′′ ×11′′ FoV) simultaneously (see Tab. 1). The data were reduced with version 0.15.0 of the SPHERE Data Reduction and Handling (DRH) pipeline (Pavlov et al. 2008), and the images were further processed using the SpeCal software (Galicher et al., in prep.). Both packages are hosted at the SPHERE Data Center (DC) in Grenoble2 (Delorme et al. 2017). Additional details on the adopted procedures are provided in Zurlo et al. (2014), Mesa et al. (2015), and Maire et al. (2016).
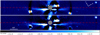 |
Fig. 1 New disk detected around GSC 07396−00759. IRDIS 5 modes PCA of H2H3 images rescaled to stellar flux before (top) and after (bottom) the subtraction of the most contaminant stars, identified with star-like points in the upper figure. The gray-shaded region in the center correspondsto the SPHERE coronagraph. The dash-dotted line is parallel to the disk semi-major axis and crosses GSC 07396−00759. The bright background objects are masked behind star-shaped regions in the upper image. |
Overview of observational SPHERE data sets for GSC 07396−00759.
2.1 Point source detection and planetary upper limits
The IFS YJ wavelength-collapsed image gives a 5σ contrast limit <11 mag in the innermost regions (< 0.25′′), which drops to ~12 mag for separations wider than ~0.3′′. The IRDIS images lead to a contrast limit of less than 12 mag at a separation of ~0.6′′ and ~13.5 mag at separations larger than 1.3′′. These performances led to the detection of 109 candidate companions (see Appendix B for their characterization) and a previously unknown faint disk (Fig. 1). None of the candidate companions are probably physically linked to GSC 07396−00759, as expected given its projected position with respect to the galactic plane. Furthermore, we converted the contrast limits into upper limits on the mass of possible unseen companions. Using the theoretical atmospheric models AMES-COND (Allard et al. 2003) with age and distance as in Table A.1, we obtained an upper limit for undetectable companions of 4 MJ in the innermost regions (< 0.25′′), which drops to 2 MJ for separations wider than ~0.6′′ (see Fig. D.1 for more details).
2.2 Spatially resolved disk
We resolved a highly inclined disk that is probably coplanar with the stellar rotation (see Appendix A) and extends more than 1.5′′ from the central star. The disk appears brighter in the southeast side (left part in Fig. 1). In Fig. 2 we plot the position of the maximum brightness (referred to as the disk spine in the following) with respect to the apparent semi-major axis (obtained with disk forward-modeling, see Sect. 3) as a function of the separation from the star, together with its intensity. This is obtained by extracting slices from the image, perpendicular to the apparent semi-major axis, and by fitting a Gaussian profile to derive the projected separation and the intensity. However, the presence of at least three very bright stars alters the light distribution of the disk after applying the aggressive algorithms of SpeCal, as shown in Fig. 1. Thus, we first proceeded to remove the stars, as described in Appendix C.1, and we obtained an image less affected by starlight residuals and self-subtraction effects. Figure 2 confirms that the SE side is noticeably brighter than the NW side. Assuming that the disk is not flared, a ring of material with radius r = 1.34 ± 0.01′′ and inclination i = 84.5 ± 3.6° (dotted line) can properly describe the observed spine up to 1.2′′. Moreover, in the outer part of both sides of the disk, the light distribution indicates some swept-back material, a warp of the disk, as clearly detected with the spine plot.
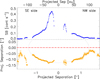 |
Fig. 2 Lowerpanel: spine plot of the disk after background star removal on the five-mode PCA IRDIS image. Upper panel: surface brightness profile along the disk as defined by the spine, in arbitrary units. |
3 Forward-modeling of the SPHERE/IRDIS data
Because of the self-subtraction effects related to the angular differential imaging process (e.g., Milli et al. 2012), one cannot directly compare a disk model image to the reduced images. An alternative possibility is to perform forward-modeling and inject negative models in the datacube before performing the angular differential process, and to try to remove any signal arising from the circumstellar disk. The modeling strategy is described in Appendix C.2.
We determined the most probable values for each of the free parameters (the reference radius r0, where the dust density distribution peaks, the inner and the outer slopes of the dust density distribution αin and αout, the inclination i and the position angle ϕ, the parameter g that governs the scattering efficiency, and the scaling factor f, see Appendix C.2) from the probability density function. The one- and two-dimensional density distributions are shown in Fig. C.1 (made using the corner package, Foreman-Mackey 2016). From the distributions we also derived the 68% confidence intervals that are reported in Table 2. The best-fit model, along with the observations and the residuals, is presented in Figure 3 with the same linear scaling. Most of the signal coming from the disk has been cancelled: there are no significant residuals toward the NW side of the star, while larger amplitude residuals are left on the SE side, close to the numerical mask. This would further suggest that the disk shows some level of asymmetry, as discussed in Sect. 2.
We found that the disk is highly inclined (i ~ 83°), with a position angle ϕ ~ 149° that it is relatively extended with a peak for the dust density distribution at ~70 au, and inner and outer slopes of 2.8 and − 2.6, respectively (the assumed radial profile is described in Appendix C.2). For the scattering phase function, we found a coefficient g ~ 0.5. Because of the high inclination, the disk is unresolved along the semi-minor axis, and we were unable to place further constraints on the entire phase function (e.g., Milli et al. 2017). To illustrate how extended the disk is according to our modeling results, Fig. 4 shows the cross-section weighted density distribution of the best-fit model, as seen from face-on.
Interestingly, the surface density beyond r0 seems to settle around a αout + 1 ~−1.5 profile that is expected for dust grains subject to a strong radial pressure force like the stellar radiation pressure, and produced by collisional grinding of larger bodies arranged in a possibly narrow “birth” ring (Strubbe & Chiang 2006; Thébault & Wu 2008; Kral et al. 2013). Because the luminosity of GSC 07396−00759 is low, the radiation pressure force never overcomes the gravitational force, as shown in Fig. 5 (blue curve), where βPR is the ratio between the two forces. This strongly suggests that the radial extent of the debris disk could rather be the consequence of a strong stellar wind pressure force, as discussed in Augereau & Beust (2006) for AU Mic. This would be consistent with the star being youngand active (Appendix A). The wind pressure force can be parametrized by the ratio βSW between thewind pressure and gravitational forces. The net pressure force acting on a grain is then defined by β = βPR + βSW (Sezestre et al. 2017). Our preliminary results shown in Fig. 5 suggest that the requirement of having a strong enough pressure force (β > 0.5) is obtained forsubmicron-sized grains and sufficiently high stellar mass loss rates (at least a few tens of the solar mass-loss rate).
Additionally, we compared our best-fitting model with the observed spectral energy distribution (SED). The photometry was gathered using the VO Sed Analyzer tool (VOSA3, Bayo et al. 2008), and no excess is detected, with the farthest wavelength at which the system has been observed being the WISE 22 μm point (<4.49 mJy, Cutri et al. 2014). Overall, our modeling results are compatible with a non-detection of the disk at wavelengths shortward of 22 μm. However, given the lack of far-IR photometric points, we cannot constrain the dust mass from the SED, therefore we incrementally increased it until we matched the WISE/W4 upper limit for non-detection, and found Mdust ~ 0.33M⊕. This would correspond to a fractional luminosity upper limit with respect to the stellar luminosity Ldisk ∕L⋆ ~ 4.3 × 10⁻³, which is still compatible with some of the brightest debris disks, such as HR 4796A.
Best-fit results for the disk modeling of the SPHERE observations.
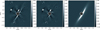 |
Fig. 3 Left to right: IRDIS data, residuals, and best-fit model. All images have the same linear scaling. Stars were removed as described in Appendix C.1. North is up, east is left. The central shaded area corresponds to the numerical mask. Color bars are in units of counts per second. |
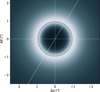 |
Fig. 4 Cross-section weighted density plot of the best-fitting model as seen from face-on. The circle marks the location of the reference radius r0 and the diagonal marks the position angle of the disk. The image has a linear scaling. |
4 Discussion
4.1 Comparison of the disks of GSC 07396−00759 and V4046 Sgr
The association with V4046 Sgr, which is still accreting and still surrounded by a gas-rich disk, raises the question of the nature of the disk around GSC 07396−00759. While none of the available observational constraints allows us to unambiguously settle this issue, several properties of this disk combined point toward an evolved optically thin debris disk instead of a primordial gas-rich disk. First, the central star does not show evidence of accreting gas. Then, there is the non-detection of an IR excess, which indicates that the disk is cold and suggests a central cavity. Moreover, for a nearly edge-on configuration, an optically thick disk should cause some absorption of the light coming from the star, which we do not observe. In addition, our modeling indicates a fractional luminosity upper limit of 4.3 × 10⁻³ that is a typical value for debris disks regime and points toward an optically thin system, since primordial or even transition disks like HD 141569 have fractional luminosities upward of ~0.01 (Wyatt et al. 2015). Finally, the surface brightness slope ~r−1.5 in the outer regions corresponds to the signature expected for the halo of small dust particles that naturally forms, in the presence of stellar radiation pressure of wind, beyond a debris ring that collisionally produces these small grains (Strubbe & Chiang 2006; Thébault & Wu 2008).
In this respect, the discovery of this probable debris disk is particularly interesting considering that the wide companion binary system V4046 Sgr instead has a gas-rich disk (see, e.g., Öberg et al. 2011; Rapson et al. 2015a,b; D’Orazi et al., in prep.). This makes the V4046 Sgr system an interesting laboratory for studying the different evolutionary timescales of coeval disks. GSC 07396−00759 is classified as a weak-line T Tauri star (Kastner et al. 2011), while the close binary V4046 Sgr is still in accretion phase (Stempels & Gahm 2004). Circumbinary disks around close binaries have been demonstrated to have longer lifetimes than disks around single stars (Alexander 2012). This might be due to the torques produced by the close binary onto the disk, which open a cavity in the disk and suppress the accretion, resulting in a longer disk lifetime. The analysis of this aspect will be further investigated in a forthcoming paper. We have indications (from the v sin i of the star) that the GSC 07396−00759 disk is highly inclined with respect to the rotation axis of the star, while the V4046 Sgr disk is coplanar with the binary orbit. Moreover, the two disks are not coplanar (i =33.5° and PA = 76° for V4046 Sgr, Rosenfeld et al. 2013).
The GSC 07396−00759 disk in scattered light appears as extended as the AU Mic disk, the most extended debris disk known around M dwarfs. Moreover, the swept-back faintest part of the disk, visible at wider separations, resembles the Moth disk (see, e.g., Schneider et al. 2014; Olofsson et al. 2016), while ripples in the spine have previously been observed in the disk of AU Mic (Boccaletti et al. 2015, 2018). The origin of these structures and their possible relation with the wide companion V4046 Sgr is beyond the scope of this work and will be studied with future observations optimized for disk characterization.
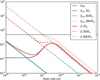 |
Fig. 5 β as a functionof grain size. The material used for βPR is M1 of Schüppler et al. (2015). Three hypotheses for the mass-loss rate of the star are shown (solid, dashed, and dotted lines). The horizontal solid black line is the upper limit for bound trajectories assuming zero eccentricity for the parent body, see Sezestre et al. (2017) for further details. |
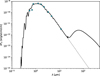 |
Fig. 6 SED of GSC 07396−00759, the photometry is shown in light blue, the stellar model in dashed gray, and the model with the maximum possible IR-excess compatible with observations is plotted in solid black. |
4.2 Debris disk around M stars
In the SHINE survey, we observed 30 M stars until September 2017. Twenty-four of them have high-qualityobservations obtained in good weather conditions. Twelve objects belong to the β Pic MG or the TW Hya MG and are therefore younger than 25 Myr. Only two disks were detected in the standard SHINE mode: AU Mic (Boccaletti et al. 2015) and GSC 07396−00759. TWA 7 was also observed in the SHINE survey, but its dusty rings were detected only in polarimetry, while no structures were observed around Proxima Cen in the standard SHINE mode (Mesa et al. 2017). As discussed in Milli et al. (2012), three main factors favor the detection of edge-on compared to face-on disks. Two of these factors are related to physical effects: i) forward-scattering is more efficient than scattering at angles close to 90°, and ii) in optically thin disks, the emitting column is longer for higher inclinations. The third factor is due to our image-analyzing procedure: the ADI process removes the azimuthal component and tends to cancel out circular structures, so that the final contrast for edge-on disks is ~100 times brighter (5 mag) than the same disk observed face-on (Milli et al. 2012). Assuming uniform distribution of disk inclinations around M stars, the probability of having a disk between 82.7° and 90° is 12.7%. Assuming SPHERE can detect all these disks, the probability of detecting at least two disks out of 12 observationsof stars surrounded by a disk is 46%. Assuming that only 50% of M dwarfs host a disk, the probability of observingtwo disks out of 12 M dwarfs is 17%; it becomes barely 1% if 10% of the young M dwarfs host a debris disk. We conclude that either there is a preferential direction in the disk orientation in both the β Pic MG and the TW Hya association (which is unexpected given the results by Ménard & Duchêne 2004), or it is more likely that this kind of disk phase is a frequent stage in the evolution of M dwarfs.
5 Summary
A new disk around the M dwarf GSC 07396−00759, probably a β Pic MG member, was detected with SPHERE in the near-infrared. We can summarize our results as follows:
-
the disk is nearly edge-on (i = 83°) and extended (r0 = 70 au, αin = 2.3 and αout = −2.7);
-
the surface density slope in the outer regions is ~−1.5;
-
the disk is asymmetric and shows swept-back wings at separations of about 1.2′′ and ripples in the spine of the disk on either side;
-
the disk probably consists of submicron-sized grains that are affected by strong stellar winds as a result of high stellar mass loss rates;
-
the disk shows a low fractional luminosity (Ldisk∕L⋆ ≤ 4 × 10⁻³);
-
the stellar rotation appears to be coplanar with the disk;
-
the star is not accreting gas.
Even if there is no “smoking gun” proof, the system characteristics all together tend to favor an evolved/debris disk nature for GSC 07396−00759 over a primordial/gas-rich disk. If confirmed, this is a very interesting discovery since this star and V4046 Sgr form a coeval physically bound system that would consist of a gas-rich circumbinary disk and a debris disk. Therefore it is of paramount importance to search for gas in the GSC 07396−00759 disk.
We detected the GSC 07396−00759 disk in the context of the SHINE survey, and these observations are therefore optimized for planet detection. The detection of two edge-on disks among the 24 M dwarfs observed so far indicates that this type of debris disk might be common among young M stars. To further constrain disk properties, especially the most faint structure we detect inthe NW side and a possible origin of its asymmetries, broad-band observations and polarimetric observationswith IRDIS are needed. Moreover, observations with other instruments at wavelengths longward of 22 μm will lead to a better estimation of the dust properties.
Acknowledgements
SPHERE is an instrument designed and built by a consortium consisting of IPAG (Grenoble, France), MPIA (Heidelberg, Germany), LAM (Marseille, France), LESIA (Paris, France), Laboratoire Lagrange (Nice, France), INAF Osservatorio Astronomico di Padova (Italy), Observatoire de Genève (Switzerland), ETH Zurich (Switzerland), NOVA (Netherlands), ONERA (France) and ASTRON (Netherlands) in collaboration with ESO. SPHERE was funded by ESO, with additional contributions from CNRS (France), MPIA (Germany), INAF (Italy), FINES (Switzerland) and NOVA (Netherlands). SPHERE also received funding from the European Commission Sixth and Seventh Framework Programmes as part of the Optical Infrared Coordination Network for Astronomy (OPTICON) under grant number RII3-Ct-2004-001566 for FP6 (2004-2008), grant number 226604 for FP7 (2009-2012) and grant number 312430 for FP7 (2013-2016). SPHERE Data Center is supported by the LabEx OSUG@2020, Investissement d’avenir – ANR10 LABX56. The authors thank the ESO Paranal Staff for support for conducting the observations. E.S., R.G., D.M., S.D. and V.D. acknowledge support from the “Progetti Premiali” funding scheme of the Italian Ministry of Education, University, and Research. This work has been supported by the project PRIN-INAF 2016 The Cradle of Life – GENESIS- SKA (General Conditions in Early Planetary Systems for the rise of life with SKA). J.O. acknowledges support from ICM Núcleo Milenio de Formación Planetaria, NPF, and from the Universidad de Valparaíso. J.-C.A. acknowledges support from the “Programme National de Planétologie” (PNP) of CNRS/INSU co-funded by the CNES. E.R. is supported by the European Union’s Horizon 2020 research and innovation programme under the Marie Skłodowska-Curie grant agreement No 664931. Q.K. acknowledges funding from the STFC via the Institute of Astronomy, Cambridge Consolidated Grant. F.M. acknowledges funding from ANR of France under contract number ANR-16-CE31-0013. We thank P. Delorme and E. Lagadec (SPHERE Data Centre) for their efficient help during the data reduction process. E.S. thanks I. Carleo and G. Munaretto for the technical support in data analysis. This research makes use of VOSA, developed under the Spanish Virtual Observatory project supported from the Spanish MICINN through grant AyA2011-24052.
Appendix A: Stellar properties
The source GSC 07396−00759 is a young and very active M1 type star. Torres et al. (2006) and Kastner et al. (2011) proposed its association with V4046 Sgr, itself a close binary with accretion signature and a prominent circumbinary disk (Stempels & Gahm 2004; Rosenfeld et al. 2013). They are probably members of the β Pictoris Moving Group (β Pic MG, Torres et al. 2006; Malo et al. 2014), whose current age estimation is 24 ± 3 Myr (Bell et al. 2015).
Stellar parameters of GSC 07396−00759.
The physical association between GSC 07396−00759 and V4046 Sgr isstrongly supported by the very similar proper motion of the components from the UCAC5 proper motions catalog (Zacharias et al. 2017), with differences at 1 mas yr−1 (compatiblewithin the uncertainties). We then assumed that V4046 Sgr and GSC 07396−00759 form a wide, hierarchical triple system, and we adopted the distance of V4046 Sgr (73 pc, Torres et al. 2006) for GSC 07396−00759. The projected separation between the components is 12 300 au (~0.06 pc), which is very wide but still compatible with a bound system, especially considering its young age (see, e.g., Andrews et al. 2017).
The star has several indicators of youth, such as the weak lithium line, coronal emission, and moderate rotation (see Table A.1). A comparison with the β Pic MG rotation versus color sequence indicates that rotation (P = 12.05 d) is slower than in the most the members, but a few similar outliers are observed, mostly stars with debris disks (Messina et al. 2017). The lithium content is within the distribution of β Pic MG members of similar colors, although a slightly higher lithium depletion could be expected considering the Li/rotation correlation observed in the temperature range including our target (Messina et al. 2016).
An effective temperature of 3632 ± 19 K was derived (from Pecaut & Mamajek 2013, weighted mean of their two determinations), while the M1 spectral type would correspond to 3630 K in the scale Pecaut and Mamajek adopted for young stars. Hereafter we use 3630 ± 50 K. By coupling this with the adopted magnitudes, the bolometric correction from Pecaut & Mamajek (2013), and the distance, we obtain a luminosity of 0.14 ± 0.02 L⊙ and a stellar radius of 0.95 ± 0.08 R⊙. The position on the color-magnitude diagram is roughly consistent with the sequence of β Pic MG for the adopted distance.
To further refine the stellar parameters, we considered the UVES (Dekker et al. 2000) high-resolution spectra available in the ESO archive4. We determined a lithium equivalent width EW(Li) of 180 ± 5 mÅ. The v sin i was determined from spectral synthesis of isolated lines in the UVES spectrum, leading to 4.17 ± 0.76 km s−1. This value, combined with the stellar radius and rotation period from Table A.1, is compatible within < 1σ with an edge-on stellar inclination.
We also checked the presence of signatures of accreting gas. H α and H β lines are detected in emission, and they present a double-peaked profile. A similar line profile is also observed in AU Mic, which is also a member of the β Pic MG, has nearly the same stellar temperature (Pecaut & Mamajek 2013), and hosts a debris disk. Houdebine & Doyle (1994) modeled these emission lines for AU Mic using a non-thermally heated chromosphere, finding a good match with the line profiles. Given the almost edge-on orientation of the disk, the H α and H β line profiles might also be interpreted as emission coming from gas in Keplerian rotation around the star and not in any accretion/ejection activity, however. If these activities were present, we would expect broader wings and more complex profiles in the hydrogen lines.
There is no indication of close companions from radial velocities (three RVs consistent within errors: Torres et al. 2006; Elliott et al. 2014, and our own determination on UVES spectra) and previous imaging observations either (Galicher et al. 2016; Janson et al. 2017).
Appendix B: Candidate companions
With only one SPHERE epoch for GSC 07396−00759, the status of the 109 companion candidates detected in the IRDIS field of view could not be determined directly. Fortunately,this star was observed in the context of the International Deep Planet Survey (IDPS; Vigan et al. 2012; Galicher et al. 2016) with the NIRC2 instrument at Keck. Deep observations were obtained in the K′ filter on June 10, 2006, in pupil-stabilized mode (with 7.9° of field rotation) to perform angular differential imaging. These data were downloaded from the Keck archive and reanalyzed with the LAM-ADI pipeline (Vigan et al. 2016) using a simple ADI procedure. The images were derotated to align north up and east left, and a spatial filter with a 5 × 5λ∕D kernel was applied to remove the smooth residual halo. The candidates visible in the field were then simply fitted with a two-dimensional Gaussian to identify their position with respect to the star. Taking into account the uncertainties on the centering of the stars and the uncertainty of the fit, we estimate a typical error of 0.5 pixel, that is, 4.98 mas in NIRC2, on the position of the candidates. For the estimation of the astrometry we did not consider any distortion or true-North correction. Finally, the candidates were manually cross-matched between the NIRC2 and IRDIS data.
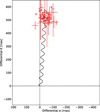 |
Fig. B.1 Differential right ascension and declination of the 70 candidates we cross-identified between the Keck/NIRC2 and SPHERE/IRDIS, compared to the track expected for a stationary background object. All 70 candidates are background stars. |
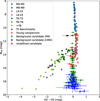 |
Fig. B.2 Color-magnitude diagram in the IRDIS H2 and H3 filters. The candidates detected in the IRDIS FoV are represented on top of the sequence of MLT objects from Leggett et al. (2001), Burgasser (2014) and Schneider et al. (2015), as well as additional young benchmark objects and companions. The candidates identified as background from propermotion (see Fig. B.1) are shown as green circles, those identified from the CMD as blue circles, and those for which the status remains undefined as red circles. The arrow marks the position of the candidate identified at a separation of 457 mas in the IFS FoV. |
Of all the candidate companions (CCs), a total of 70 were cross-identified in the two data sets. Figure B.1presents the differential right ascension and declination of these 70 candidates between the two epochs, compared to the track expected for a stationary background object. Even though the astrometric error for some candidates is significant in the IRDIS data, the baseline of more than 10 years is sufficient to unambiguously conclude that all these 70 candidates are background stars. Of the remaining candidates, 32 can be identified as background objects using their location in the color-magnitude diagram (CMD) in the IRDIS H2 and H3 filters. Figure B.2 shows all the candidates in a CMD compared to sequences of MLT objects from Leggett et al. (2001), Burgasser (2014) and Schneider et al. (2015). The candidates located near the zero-color and with MH2 > 16 cannot represent physical objects in orbit around GSC 07396−00759 and are therefore classified as background. Finally, the status of the remaining 7 candidates cannot be determined unambiguously. However, we note that 6 of them are located at separations larger than 5.5′′, that is, at projected physical separations larger than 400 au. The only candidate located at small angular separation (457 mas), which is also identified in the IFS field-of-view, presents a color H2 −H3 = −0.07 ± 0.1 that is clearly offset at ~2σ with respectto the ML sequence (point identified by an arrow in Fig. B.2). This offset is well aligned with the other candidates identified as background from proper motion (Fig. B.1). Moreover, its J − H = 0.78 agrees with a background object. To further confirm its nature, we tested that this bright object would be visible in NIRC2 data (5σ contrast limit in Kp is 8.9 mag at 0.5′′, Galicher et al. 2016) if comoving, while it will be at about 50 mas from the star if background and therefore not visible. As a conclusion, all the candidates detected with projected physical separation below 400 au are identified as background stars.
Appendix C: Modeling of the SPHERE/IRDIS data
C.1 Point source removal
To reduce the effect of the field stars on the disk image, we removed the most contaminant field stars, replacing each star contribution in each raw individual frame of the data set by the background contribution, accounting for the parallactic rotation. The stellar flux in is then replaced by the adjusted background inside a box of 17 × 17 pixel. These boxes rotated with the field of view during the sequence. After the ADI reduction steps, we removed residual artifacts from the bright CCs by replacing the 20 × 20 pixel box area centered on the CCs with the right orientation by a fitted background. This new reduction removed the grooves created by the brightest field stars after application of the ADI and therefore better constraints on the disk properties are possible.
C.2 Modeling strategy
We used the same code as was used in Olofsson et al. (2016) and Feldt et al. (2017) and followed thesame strategy. For the stellar parameters, we used an effective temperature of 3600 K and a distance of 73 pc. For the disk parameters, the free parameters were the following: the inclination i, the position angle ϕ, the reference radius r0, and the inner and outer slopes (αin and αout, respectively) of the volumetric dust density distribution n(r, z), which is defined as
![\begin{equation*}n(r, z) \propto \left[\left(\frac{r}{r_0}\right)^{-2\alpha_{\mathrm{in}}} + \left(\frac{r}{r_0}\right)^{-2\alpha_{\mathrm{out}}}\right]^{-1/2} \times \mathrm{e}^{-z^2/2h^2}, \end{equation*}](/articles/aa/full_html/2018/05/aa32740-18/aa32740-18-eq1.png) (C.1)
(C.1)
where h = r ×tan(ψ) and ψ is the opening angle. To reduce the number of free parameters, we fixed ψ =0.04 (Thébault 2009). Overall, we did not resolve the disk in the vertical direction, and preliminary tests suggested that we cannot really constrain the value of h. For the dust properties, we assumed a grain size distribution that follows a differential power law dn(s) ∝ s−3.5ds, where s is the grain size (Dohnanyi 1969), between smin = 0.01μm and smax = 1 mm. The optical constants are those for astro-silicates from Draine (2003), and the absorption and scattering efficiencies are computed using the Mie theory. To have a finer control on the shape of the scattering phase function S11, we used the Henyey-Greenstein approximation rather than the Mie theory. This adds one free parameter g, which governs the scattering efficiency as a function of the scattering angle θ. Overall, because we modeled a monochromatic image and the scattered light contribution dominates the thermal emission in the near-infrared, the previous choices for the dust properties (e.g., smin or smax) have little effect on the modeling results. The vertical distribution of the disk follows a Gaussian profile with a standard deviation h = 0.04 × r.
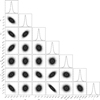 |
Fig. C.1 Projected probability density distributions for the different parameters in the modeling as well as density plots. |
To estimate the goodness of fit, it is first necessary to estimate the uncertainties. This is performed on the collapsed observations by measuring the standard deviation in concentric annuli with widths of 2 pixels. Because of the disk, we overestimate the proper uncertainties.
For a given model and for each frame of the original datacube, we subtracted a scaled image of the model (the scaling factor being 10f, the last free parameter being f) derotated at the corresponding parallactic angle of that frame. We then performed the principal component analysis, removing the five main components, and collapsed all the frames after derotating them of their parallactic angles. The goodness of fit is the sum of the squared residuals divided by the uncertainties. To speed up the modeling process, we cropped each frame of the datacube to have sizes of 300 × 300 pixels. Additionally, we placed a numerical mask of 0.2″ in radius.
To summarize, we have seven free parameters: r0, αin, αout, i, ϕ, g, and f, and we used an affine invariant ensemble sampler to find the best solution (Foreman-Mackey et al. 2013). The Monte Carlo Markov chain was composed of 100 walkers, with an initial burn-in phase of 500 steps, and it was run for additional 1000 steps afterward. At the end of the modeling, the mean acceptance fraction was 0.498 and the maximum autocorrelation time was 54 steps (Fig. C.1).
Appendix D: Mass limit estimation
The contrast and mass limit for unseen companions was determined for both IFS and IRDIS. Since the grooves related to the very bright stars after ADI were not negligible, we estimated the limits on the images after contaminant star removal (see Appendix C.1 for details). The azimuthally averaged 5σ contrast curves were estimated on the wavelength-collapsed monochromatic five-component PCA reduction for IFS and template locally optimized combination of images (TLOCI, Marois et al. 2014) reduction for IRDIS, and they are shown in Fig. D.1 (upper panel). We then used the theoretical atmospheric models AMES-COND (Allard et al. 2003)to convert this limit into the unseen companion mass limit (Fig. D.1, bottom panel).
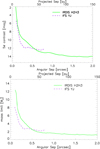 |
Fig. D.1 5σ contrast curves and companion mass limits derived for IFS (dashed line) and for IRDIS H2H3 (solid line) using PCA reduction method and TLOCI reduction method, respectively, both after the brightest CCs subtraction as described in Appendix C.1. |
References
- Adams, F. C., Hollenbach, D., Laughlin, G., & Gorti, U. 2004, ApJ, 611, 360 [NASA ADS] [CrossRef] [Google Scholar]
- Alexander, R. 2012, ApJ, 757, L29 [NASA ADS] [CrossRef] [Google Scholar]
- Allard, F., Guillot, T., Ludwig, H.-G., et al. 2003, ed. B. Dwarfs, & E. Martín, IAU Symp., 211, 325 [Google Scholar]
- Andrews, J. J., Chanamé, J., & Agüeros, M. A. 2017, MNRAS, 472, 675 [NASA ADS] [CrossRef] [Google Scholar]
- Anglada, G., Amado, P. J., Ortiz, J. L., et al. 2017, ApJ, 850, L6 [NASA ADS] [CrossRef] [Google Scholar]
- Anglada-Escudé, G., Amado, P. J., Barnes, J., et al. 2016, Nature, 536, 437 [NASA ADS] [CrossRef] [PubMed] [Google Scholar]
- Augereau, J.-C., & Beust, H. 2006, A&A, 455, 987 [NASA ADS] [CrossRef] [EDP Sciences] [Google Scholar]
- Avenhaus, H., Schmid, H. M., & Meyer, M. R. 2012, A&A, 548, A105 [NASA ADS] [CrossRef] [EDP Sciences] [Google Scholar]
- Bayo, A., Rodrigo, C., Barrado Y Navascués, D., et al. 2008, A&A, 492, 277 [NASA ADS] [CrossRef] [EDP Sciences] [Google Scholar]
- Bell, C. P. M., Mamajek, E. E., & Naylor, T. 2015, MNRAS, 454, 593 [NASA ADS] [CrossRef] [Google Scholar]
- Beuzit, J.-L., Feldt, M., Dohlen, K., et al. 2008, in Ground-based and Airborne Instrumentation for Astronomy II, Proc. SPIE, 7014, 701418 [CrossRef] [Google Scholar]
- Boccaletti, A., Sezestre, E., Lagrange, A.-M., et al. 2018, A&A, in press, DOI:10.1051/0004-6361/201732462 [Google Scholar]
- Boccaletti, A., Thalmann, C., Lagrange, A.-M., et al. 2015, Nature, 526, 230 [NASA ADS] [CrossRef] [Google Scholar]
- Bonfils, X., Delfosse, X., Udry, S., et al. 2013, A&A, 549, A109 [NASA ADS] [CrossRef] [EDP Sciences] [Google Scholar]
- Burgasser, A. J. 2014, Astronomical Society of India Conference Series, 11 [Google Scholar]
- Carpenter, J. M., Mamajek, E. E., Hillenbrand, L. A., & Meyer, M. R. 2006, ApJ, 651, L49 [NASA ADS] [CrossRef] [Google Scholar]
- Choquet, É., Perrin, M. D., Chen, C. H., et al. 2016, ApJ, 817, L2 [NASA ADS] [CrossRef] [Google Scholar]
- Claudi, R. U., Turatto, M., Gratton, R. G., et al. 2008, in Ground-based and Airborne Instrumentation for Astronomy II, Proc. SPIE, 7014, 70143E [Google Scholar]
- Cutri, R. M., et al. 2014, VizieR Online Data Catalog: II/328 [Google Scholar]
- Dekker, H., D’Odorico, S., Kaufer, A., Delabre, B., & Kotzlowski, H. 2000, in Optical and IR Telescope Instrumentation and Detectors, eds. M. Iye, & A. F. Moorwood, Proc. SPIE, 4008, 534 [Google Scholar]
- Delorme, P., Meunier, N., Albert, D., et al. 2017, SF2A-2017: Proc. of the Annual meeting of the French Society of Astronomy and Astrophysics, 4–7 July 2017, Paris, eds. [Google Scholar]
- Dohlen, K., Langlois, M., Saisse, M., et al. 2008, in Ground-based and Airborne Instrumentation for Astronomy II, Proc. SPIE, 7014, 70143L [CrossRef] [Google Scholar]
- Dohnanyi, J. S. 1969, J. Geophys. Res., 74, 2531 [NASA ADS] [CrossRef] [Google Scholar]
- Draine, B. T. 2003, ApJ, 598, 1026 [NASA ADS] [CrossRef] [Google Scholar]
- Dressing, C. D., & Charbonneau, D. 2015, ApJ, 807, 45 [NASA ADS] [CrossRef] [Google Scholar]
- Elliott, P., Bayo, A., Melo, C. H. F., et al. 2014, A&A, 568, A26 [NASA ADS] [CrossRef] [EDP Sciences] [Google Scholar]
- Feldt, M., Olofsson, J., Boccaletti, A., et al. 2017, A&A, 601, A7 [NASA ADS] [CrossRef] [EDP Sciences] [Google Scholar]
- Foreman-Mackey, D. 2016, J. Open Sour. Softw., 24 [NASA ADS] [CrossRef] [Google Scholar]
- Foreman-Mackey, D., Hogg, D. W., Lang, D., & Goodman, J. 2013, PASP, 125, 306 [CrossRef] [Google Scholar]
- Galicher, R., Marois, C., Macintosh, B., et al. 2016, A&A, 594, A63 [NASA ADS] [CrossRef] [EDP Sciences] [Google Scholar]
- Gautier, III T. N., Rieke, G. H., Stansberry, J., et al. 2007, ApJ, 667, 527 [NASA ADS] [CrossRef] [Google Scholar]
- Houdebine, E. R., & Doyle, J. G. 1994, A&A, 289, 185 [NASA ADS] [Google Scholar]
- Janson, M., Durkan, S., Hippler, S., et al. 2017, A&A, 599, A70 [NASA ADS] [CrossRef] [EDP Sciences] [Google Scholar]
- Kalas, P., Liu, M. C., & Matthews, B. C. 2004, Science, 303, 1990 [NASA ADS] [CrossRef] [PubMed] [Google Scholar]
- Kastner, J. H., Sacco, G. G., Montez, R., et al. 2011, ApJ, 740, L17 [NASA ADS] [CrossRef] [Google Scholar]
- Kral, Q., Thébault, P., & Charnoz, S. 2013, A&A, 558, A121 [NASA ADS] [CrossRef] [EDP Sciences] [Google Scholar]
- Krivov, A. V. 2010, Res. Astron. Astrophys., 10, 383 [NASA ADS] [CrossRef] [Google Scholar]
- Leggett, S. K., Allard, F., Geballe, T. R., Hauschildt, P. H., & Schweitzer, A. 2001, ApJ, 548, 908 [NASA ADS] [CrossRef] [Google Scholar]
- Lestrade, J.-F., Wyatt, M. C., Bertoldi, F., Dent, W. R. F., & Menten, K. M. 2006, A&A, 460, 733 [NASA ADS] [CrossRef] [EDP Sciences] [Google Scholar]
- Lestrade, J.-F., Wyatt, M. C., Bertoldi, F., Menten, K. M., & Labaigt, G. 2009, A&A, 506, 1455 [NASA ADS] [CrossRef] [EDP Sciences] [Google Scholar]
- Lestrade, J.-F., Morey, E., Lassus, A., & Phou, N. 2011, A&A, 532, A120 [NASA ADS] [CrossRef] [EDP Sciences] [Google Scholar]
- Lestrade, J.-F., Matthews, B. C., Sibthorpe, B., et al. 2012, A&A, 548, A86 [NASA ADS] [CrossRef] [EDP Sciences] [Google Scholar]
- Luhman, K. L., & Mamajek, E. E. 2012, ApJ, 758, 31 [NASA ADS] [CrossRef] [Google Scholar]
- MacGregor, M. A., Weinberger, A. J., Wilner, D. J., Kowalski, A. F., & Cranmer, S. R. 2018, ApJ, 855, L2 [NASA ADS] [CrossRef] [Google Scholar]
- Maire, A.-L., Langlois, M., Dohlen, K., et al. 2016, SPIE Conf. Ser., Proc. SPIE, 9908, 990834 [CrossRef] [Google Scholar]
- Malo, L., Artigau, É., Doyon, R., et al. 2014, ApJ, 788, 81 [NASA ADS] [CrossRef] [Google Scholar]
- Marois, C., Correia, C., Véran, J.-P., & Currie, T. 2014, in Exploring the Formation and Evolution of Planetary Systems, eds. M. Booth, B. C. Matthews, & J. R. Graham, IAU Symp., 299, 48 [NASA ADS] [Google Scholar]
- Matthews, B. C., Krivov, A. V., Wyatt, M. C., Bryden, G., & Eiroa, C. 2014, Protostars and Planets VI, 521 [Google Scholar]
- Mayor, M., Bonfils, X., Forveille, T., et al. 2009, A&A, 507, 487 [NASA ADS] [CrossRef] [EDP Sciences] [Google Scholar]
- Ménard, F., & Duchêne, G. 2004, A&A, 425, 973 [NASA ADS] [CrossRef] [EDP Sciences] [Google Scholar]
- Mesa, D., Gratton, R., Zurlo, A., et al. 2015, A&A, 576, A121 [NASA ADS] [CrossRef] [EDP Sciences] [Google Scholar]
- Mesa, D., Zurlo, A., Milli, J., et al. 2017, MNRAS, 466, L118 [NASA ADS] [CrossRef] [Google Scholar]
- Messina, S., Lanzafame, A. C., Feiden, G. A., et al. 2016, A&A, 596, A29 [NASA ADS] [CrossRef] [EDP Sciences] [Google Scholar]
- Messina, S., Millward, M., Buccino, A., et al. 2017, A&A, 600, A83 [NASA ADS] [CrossRef] [EDP Sciences] [Google Scholar]
- Milli, J., Mouillet, D., Lagrange, A.-M., et al. 2012, A&A, 545, A111 [NASA ADS] [CrossRef] [EDP Sciences] [Google Scholar]
- Milli, J., Vigan, A., Mouillet, D., et al. 2017, A&A, 599, A108 [NASA ADS] [CrossRef] [EDP Sciences] [Google Scholar]
- Moro Martin A. 2013, Dusty Planetary Systems, eds. T. D. Oswalt, L. M. French, & P. Kalas, 431 [Google Scholar]
- Öberg, K. I., Qi, C., Fogel, J. K. J., et al. 2011, ApJ, 734, 98 [NASA ADS] [CrossRef] [Google Scholar]
- Olofsson, J., Samland, M., Avenhaus, H., et al. 2016, A&A, 591, A108 [NASA ADS] [CrossRef] [EDP Sciences] [Google Scholar]
- Olofsson, J., van Holstein, R. G., Boccaletti, A., et al. 2018, A&A, submitted Doi:10.1051/0004-6361/201832583 [Google Scholar]
- Pavlov, A., Möller-Nilsson, O., Feldt, M., et al. 2008, in Advanced Software and Control for Astronomy II, Proc. SPIE, 7019 701939 [CrossRef] [Google Scholar]
- Pecaut, M. J., & Mamajek, E. E. 2013, ApJS, 208, 9 [NASA ADS] [CrossRef] [Google Scholar]
- Plavchan, P., Jura, M., & Lipscy, S. J. 2005, ApJ, 631, 1161 [NASA ADS] [CrossRef] [Google Scholar]
- Rapson, V. A., Kastner, J. H., Andrews, S. M., et al. 2015a, ApJ, 803, L10 [NASA ADS] [CrossRef] [Google Scholar]
- Rapson, V. A., Sargent, B., Germano Sacco, G., et al. 2015b, ApJ, 810, 62 [NASA ADS] [CrossRef] [Google Scholar]
- Raymond, S. N., Armitage, P. J., Moro-Martín, A., et al. 2011, A&A, 530, A62 [NASA ADS] [CrossRef] [EDP Sciences] [Google Scholar]
- Rosenfeld, K. A., Andrews, S. M., Wilner, D. J., Kastner, J. H., & McClure, M. K. 2013, ApJ, 775, 136 [NASA ADS] [CrossRef] [Google Scholar]
- Schneider, G., Grady, C. A., Hines, D. C., et al. 2014, AJ, 148, 59 [NASA ADS] [CrossRef] [Google Scholar]
- Schneider, A. C., Cushing, M. C., Kirkpatrick, J. D., et al. 2015, ApJ, 804, 92 [NASA ADS] [CrossRef] [Google Scholar]
- Schüppler, C., Löhne, T., Krivov, A. V., et al. 2015, A&A, 581, A97 [NASA ADS] [CrossRef] [EDP Sciences] [Google Scholar]
- Sezestre, É., Augereau, J.-C., Boccaletti, A., & Thébault, P. 2017, A&A, 607, A65 [NASA ADS] [CrossRef] [EDP Sciences] [Google Scholar]
- Stempels, H. C., & Gahm, G. F. 2004, A&A, 421, 1159 [NASA ADS] [CrossRef] [EDP Sciences] [Google Scholar]
- Strubbe, L. E., & Chiang, E. I. 2006, ApJ, 648, 652 [NASA ADS] [CrossRef] [Google Scholar]
- Thébault, P. 2009, A&A, 505, 1269 [NASA ADS] [CrossRef] [EDP Sciences] [Google Scholar]
- Thébault, P.,& Wu, Y. 2008, A&A, 481, 713 [NASA ADS] [CrossRef] [EDP Sciences] [Google Scholar]
- Torres, C. A. O., Quast, G. R., da Silva, L., et al. 2006, A&A, 460, 695 [NASA ADS] [CrossRef] [EDP Sciences] [Google Scholar]
- Vigan, A., Moutou, C., Langlois, M., et al. 2010, MNRAS, 407, 71 [NASA ADS] [CrossRef] [Google Scholar]
- Vigan, A., Patience, J., Marois, C., et al. 2012, A&A, 544, A9 [NASA ADS] [CrossRef] [EDP Sciences] [Google Scholar]
- Vigan, A., Bonnefoy, M., Ginski, C., et al. 2016, A&A, 587, A55 [NASA ADS] [CrossRef] [EDP Sciences] [Google Scholar]
- Wyatt, M. C., Panić, O., Kennedy, G. M., & Matrà, L. 2015, Ap&SS, 357, 103 [NASA ADS] [CrossRef] [Google Scholar]
- Zacharias, N., Finch, C., & Frouard, J. 2017, AJ, 153, 166 [NASA ADS] [CrossRef] [Google Scholar]
- Zurlo, A., Vigan, A., Mesa, D., et al. 2014, A&A, 572, A85 [NASA ADS] [CrossRef] [EDP Sciences] [Google Scholar]
To this short list of direct imaging resolved debris disks, we can also add the two debris disks of TWA 7 (Choquet et al. 2016; Olofsson et al. 2018) and TWA 25 (Choquet et al. 2016). These debris disks were found around stars younger than 15 Myr and belong to an age bin where the frequency of primordial disks is still significant.
All Tables
All Figures
|
Fig. 1 New disk detected around GSC 07396−00759. IRDIS 5 modes PCA of H2H3 images rescaled to stellar flux before (top) and after (bottom) the subtraction of the most contaminant stars, identified with star-like points in the upper figure. The gray-shaded region in the center correspondsto the SPHERE coronagraph. The dash-dotted line is parallel to the disk semi-major axis and crosses GSC 07396−00759. The bright background objects are masked behind star-shaped regions in the upper image. |
| In the text | |
|
Fig. 2 Lowerpanel: spine plot of the disk after background star removal on the five-mode PCA IRDIS image. Upper panel: surface brightness profile along the disk as defined by the spine, in arbitrary units. |
| In the text | |
|
Fig. 3 Left to right: IRDIS data, residuals, and best-fit model. All images have the same linear scaling. Stars were removed as described in Appendix C.1. North is up, east is left. The central shaded area corresponds to the numerical mask. Color bars are in units of counts per second. |
| In the text | |
|
Fig. 4 Cross-section weighted density plot of the best-fitting model as seen from face-on. The circle marks the location of the reference radius r0 and the diagonal marks the position angle of the disk. The image has a linear scaling. |
| In the text | |
|
Fig. 5 β as a functionof grain size. The material used for βPR is M1 of Schüppler et al. (2015). Three hypotheses for the mass-loss rate of the star are shown (solid, dashed, and dotted lines). The horizontal solid black line is the upper limit for bound trajectories assuming zero eccentricity for the parent body, see Sezestre et al. (2017) for further details. |
| In the text | |
|
Fig. 6 SED of GSC 07396−00759, the photometry is shown in light blue, the stellar model in dashed gray, and the model with the maximum possible IR-excess compatible with observations is plotted in solid black. |
| In the text | |
|
Fig. B.1 Differential right ascension and declination of the 70 candidates we cross-identified between the Keck/NIRC2 and SPHERE/IRDIS, compared to the track expected for a stationary background object. All 70 candidates are background stars. |
| In the text | |
|
Fig. B.2 Color-magnitude diagram in the IRDIS H2 and H3 filters. The candidates detected in the IRDIS FoV are represented on top of the sequence of MLT objects from Leggett et al. (2001), Burgasser (2014) and Schneider et al. (2015), as well as additional young benchmark objects and companions. The candidates identified as background from propermotion (see Fig. B.1) are shown as green circles, those identified from the CMD as blue circles, and those for which the status remains undefined as red circles. The arrow marks the position of the candidate identified at a separation of 457 mas in the IFS FoV. |
| In the text | |
|
Fig. C.1 Projected probability density distributions for the different parameters in the modeling as well as density plots. |
| In the text | |
|
Fig. D.1 5σ contrast curves and companion mass limits derived for IFS (dashed line) and for IRDIS H2H3 (solid line) using PCA reduction method and TLOCI reduction method, respectively, both after the brightest CCs subtraction as described in Appendix C.1. |
| In the text | |
Current usage metrics show cumulative count of Article Views (full-text article views including HTML views, PDF and ePub downloads, according to the available data) and Abstracts Views on Vision4Press platform.
Data correspond to usage on the plateform after 2015. The current usage metrics is available 48-96 hours after online publication and is updated daily on week days.
Initial download of the metrics may take a while.