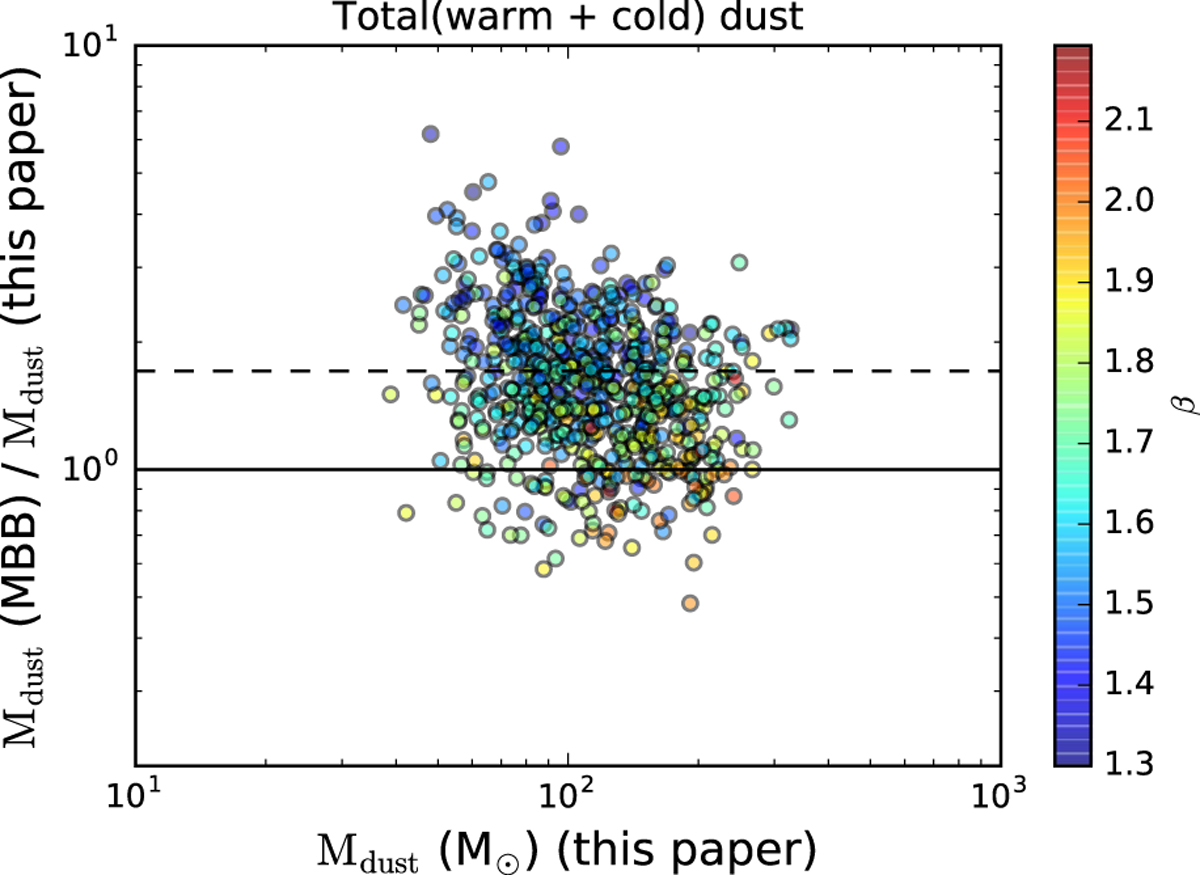
Fig. 5

Comparison of the dust masses obtained in this paper and those derived by Tabatabaei et al. (2014) with two MBBs. Each point corresponds to one pixel on the sky. Only independent data points have been considered to compare both masses (see text for details). The mean value and standard deviation of the ratio between the dust mass derived from Tabatabaei et al. (2014) and from this study is 1.7 (dashed line) and 0.7, respectively. The relative uncertainties for the dust masses derived in this paper are ~25%.
Current usage metrics show cumulative count of Article Views (full-text article views including HTML views, PDF and ePub downloads, according to the available data) and Abstracts Views on Vision4Press platform.
Data correspond to usage on the plateform after 2015. The current usage metrics is available 48-96 hours after online publication and is updated daily on week days.
Initial download of the metrics may take a while.


