Fig. 3
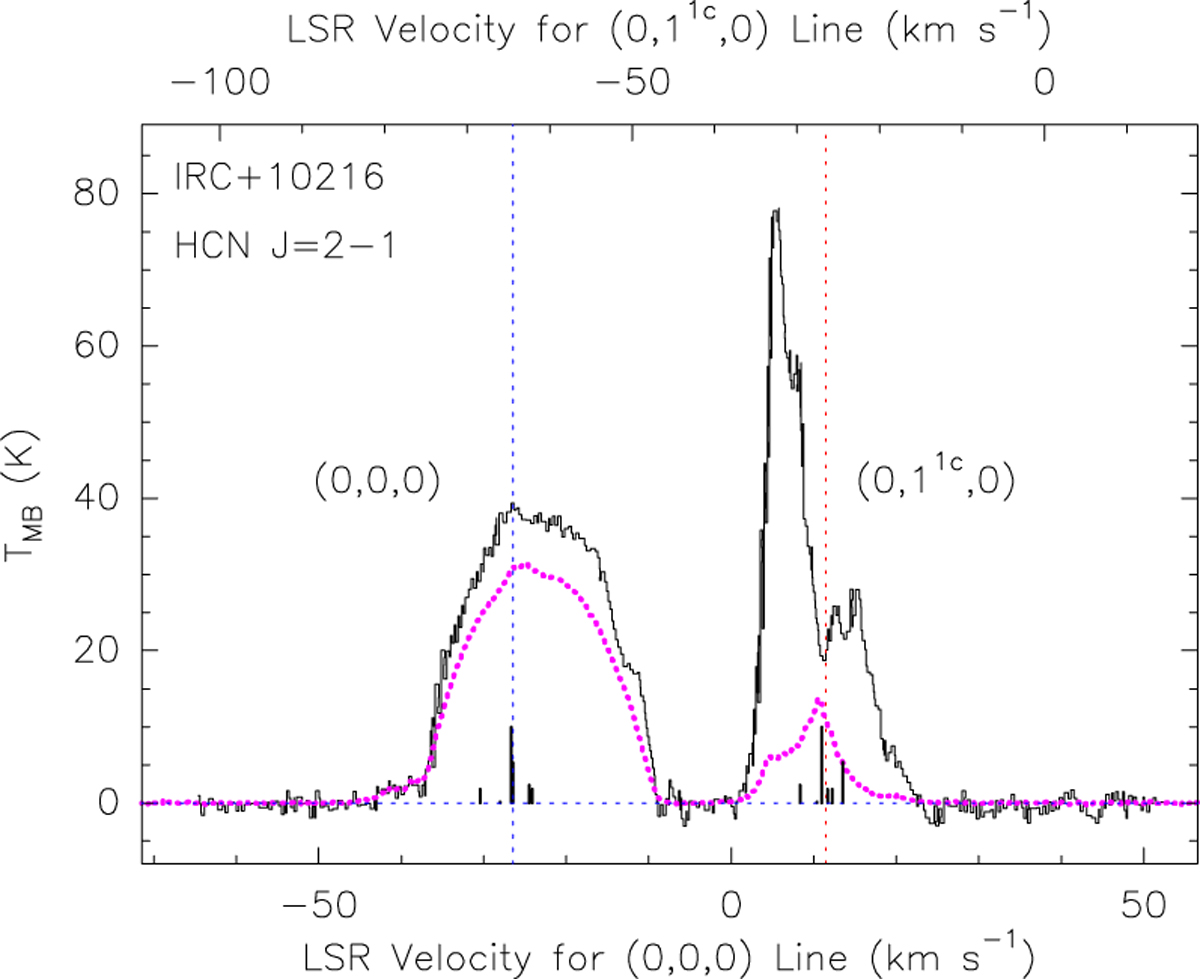
Comparison of the spectra for the HCN J = 2 → 1 (0,0,0) and (0, 11c, 0) lines taken with the IRAM 30 m telescope in 1989 April by Lucas & Cernicharo (1989) (full line spectrum) and with the APEX 12 m telescope on 2015 May 28 (dotted magenta line spectrum). The bottom and top LSR velocity scales are appropriate for the (0,0,0) and the (0, 1 1c, 0) lines, respectively. Both spectra have a velocity resolution of 0.26 km s−1. The vertical bars give the relative intensities and velocities or the hfs components of the two lines. The intensity of the strongest component is normalized to TMB = 10 K.
Current usage metrics show cumulative count of Article Views (full-text article views including HTML views, PDF and ePub downloads, according to the available data) and Abstracts Views on Vision4Press platform.
Data correspond to usage on the plateform after 2015. The current usage metrics is available 48-96 hours after online publication and is updated daily on week days.
Initial download of the metrics may take a while.