Fig. 1
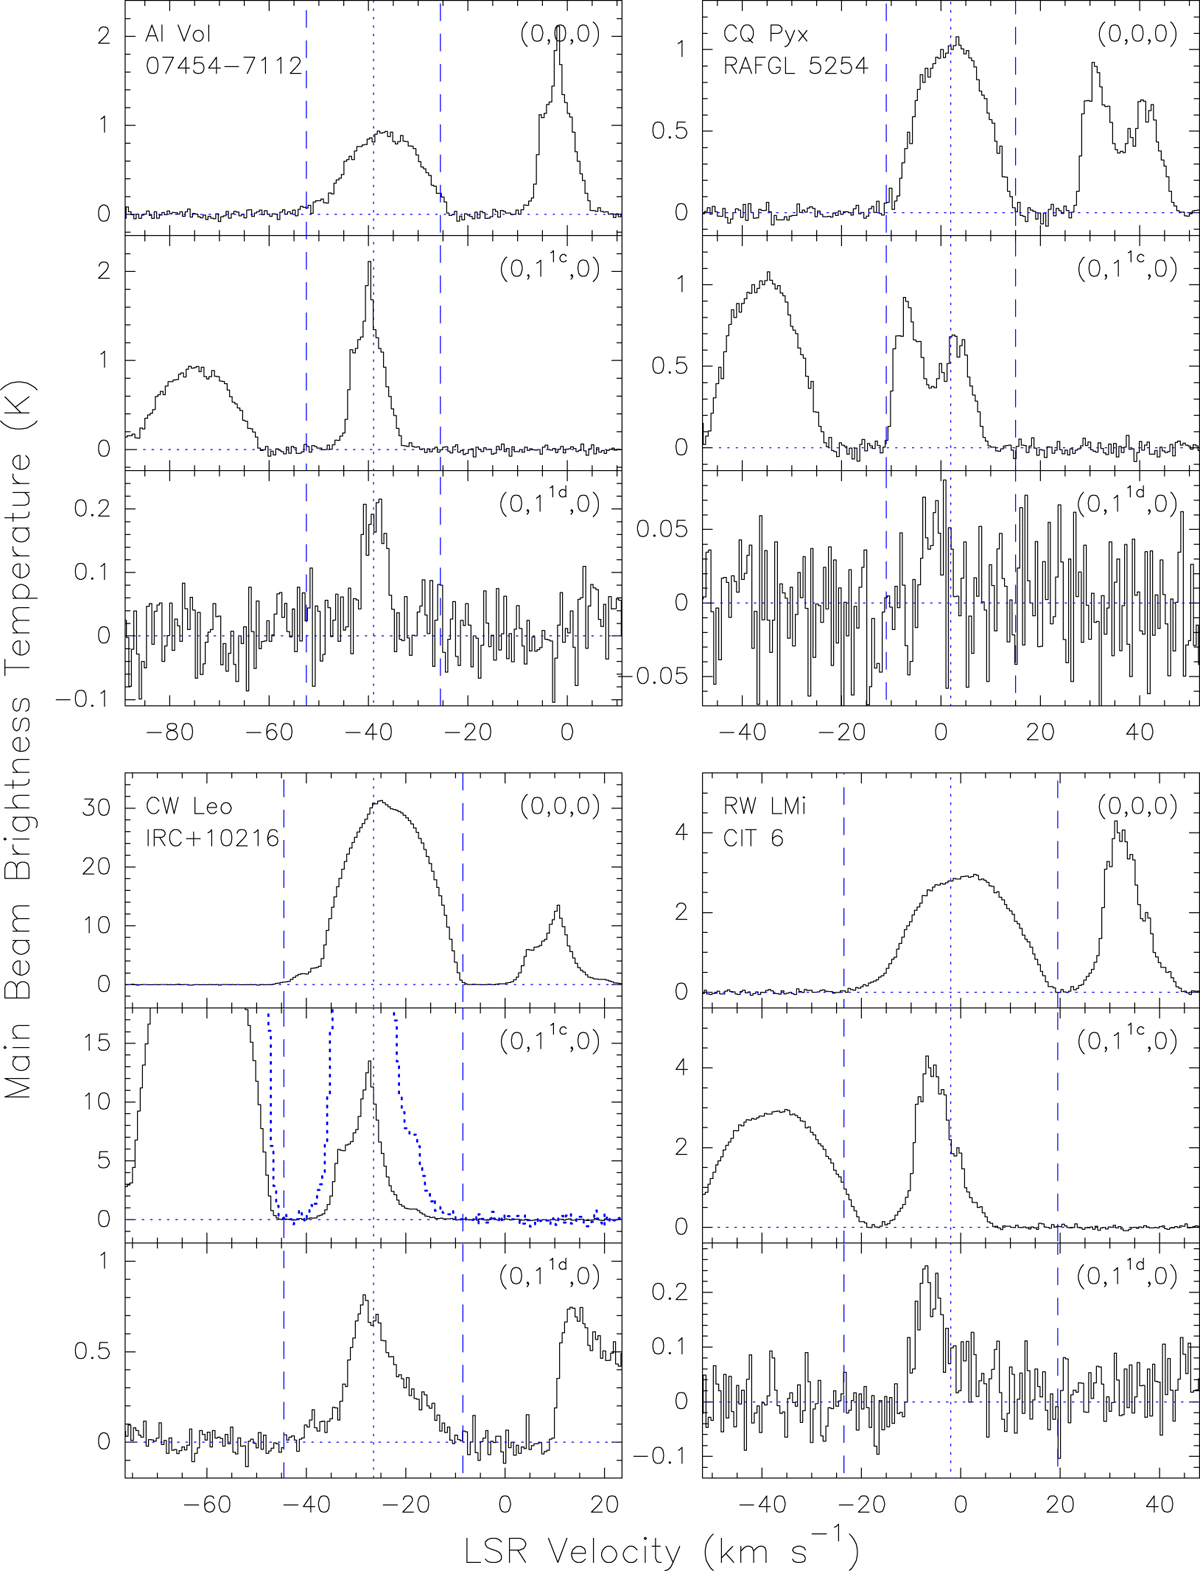
APEX spectra of the four sources toward which all three HCN J = 2 → 1 lines are detected. For each source, the upper, middle, and lower panels show the spectra for the (0,0,0), (0, 1 1c, 0), and (0, 11d, 0) lines, respectively. 1 K TMB corresponds to a flux density of 33.4 Jy. To facilitate the comparison between the lines, we used the same intensity scale for the first two lines, except for CW Leo. In addition, for CW Leo, the TMB scale of the dotted blue line shows the base of the (0, 11c, 0) spectrum scaled up by a factor of 8 compared to the ordinate in that panel. To adequately display the weak (0, 1 1d, 0) emission, a compressed TMB scale is used for all sources for this line. The vertical dotted blue line marks the stellar velocity, while the dashed blue lines indicate the terminal velocity. The spectral line partially appearing in the (0, 1 1d, 0) spectrum of IRC+10216 at velocities > 10 km s−1 is part of a multiplet component of the N = 18 → 17 transition of C3N.
Current usage metrics show cumulative count of Article Views (full-text article views including HTML views, PDF and ePub downloads, according to the available data) and Abstracts Views on Vision4Press platform.
Data correspond to usage on the plateform after 2015. The current usage metrics is available 48-96 hours after online publication and is updated daily on week days.
Initial download of the metrics may take a while.