Fig. 6
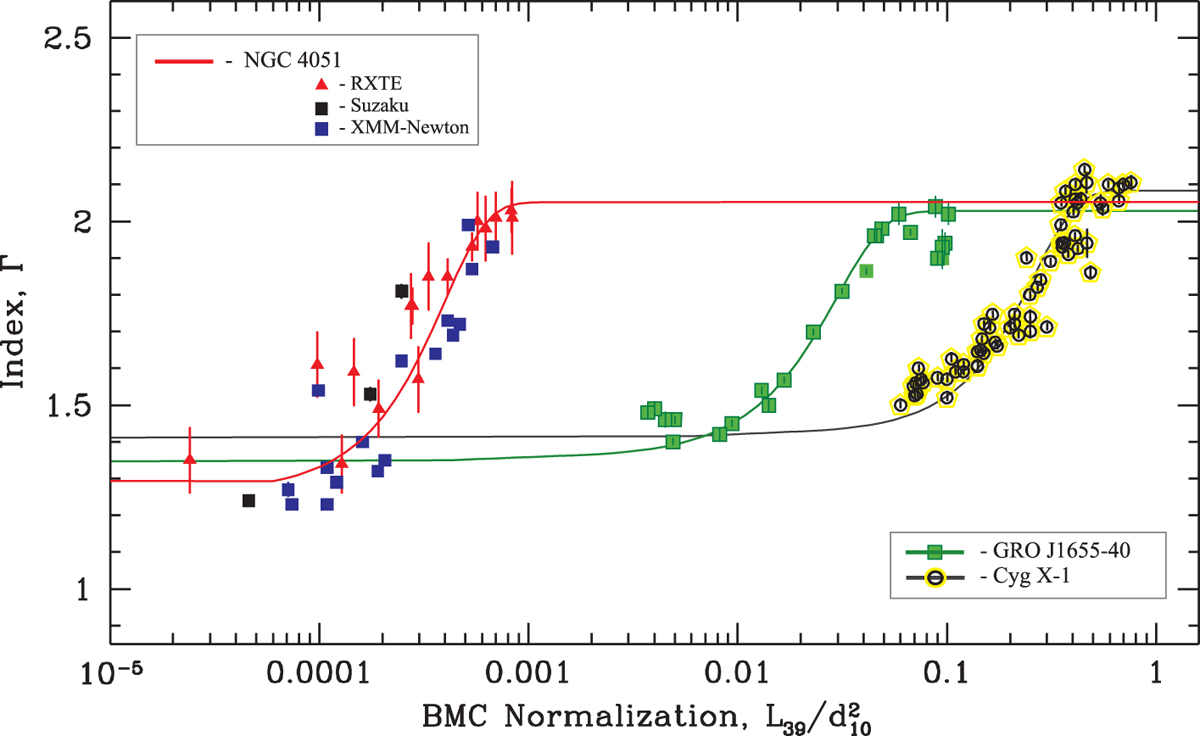
Scaling of the photon index versus normalization for NGC 4051 (red line – target source), and GRO J1655–40 and Cygnus X-1 (reference sources, green and black lines, respectively). Red triangles, black and blue squares correspond to RXTE, Suzaku and XMM-Newton data. Green squares and yellow-black circles correspond to RXTE data for GRO J1655–40 and Cygnus X-1, respectively.
Current usage metrics show cumulative count of Article Views (full-text article views including HTML views, PDF and ePub downloads, according to the available data) and Abstracts Views on Vision4Press platform.
Data correspond to usage on the plateform after 2015. The current usage metrics is available 48-96 hours after online publication and is updated daily on week days.
Initial download of the metrics may take a while.