Free Access
Fig. 3
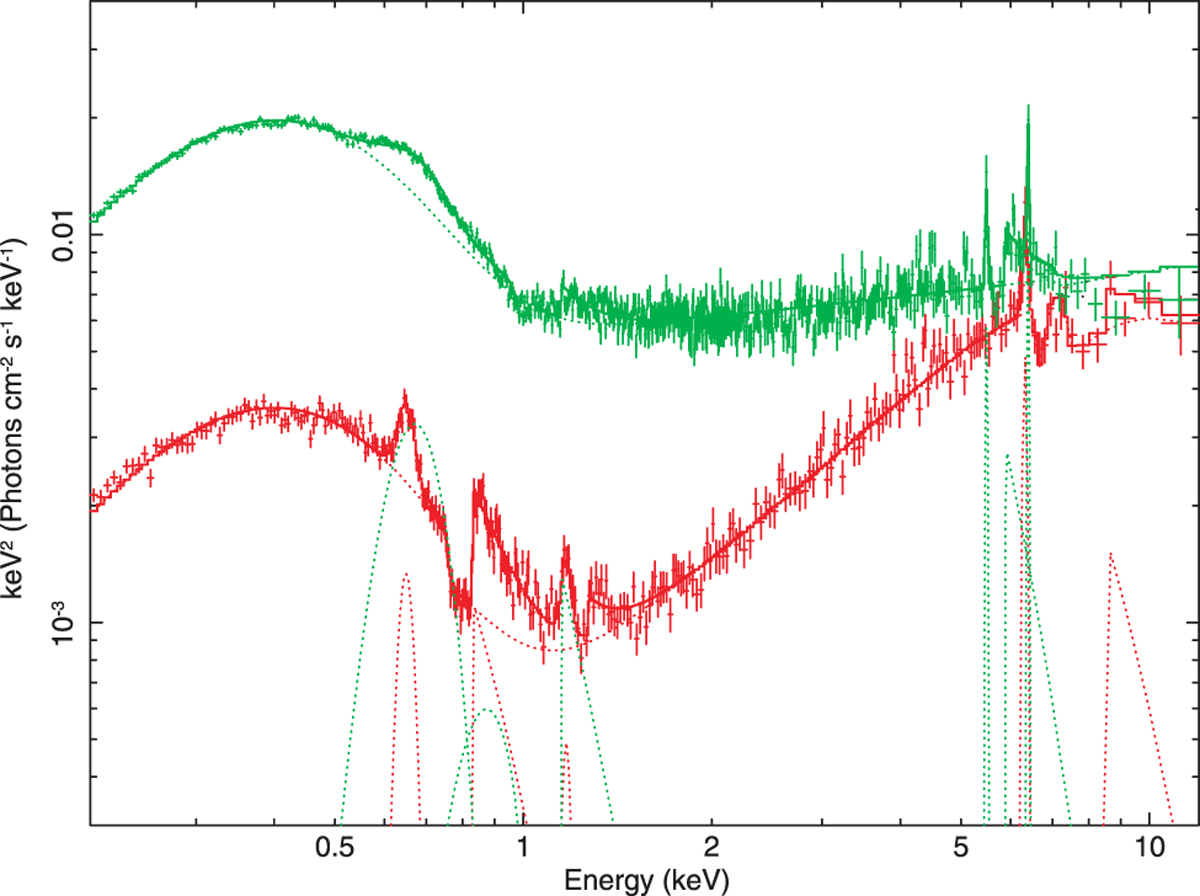
Spectral evolution using XMM-Newton data of NGC4051 for different spectral states: the LHS spectrum (May 11, 2009 – red points) and the IS spectrum (May 15, 2009 – green points). Curves are related to the best-fit model (see details in text).
Current usage metrics show cumulative count of Article Views (full-text article views including HTML views, PDF and ePub downloads, according to the available data) and Abstracts Views on Vision4Press platform.
Data correspond to usage on the plateform after 2015. The current usage metrics is available 48-96 hours after online publication and is updated daily on week days.
Initial download of the metrics may take a while.