Fig. 2
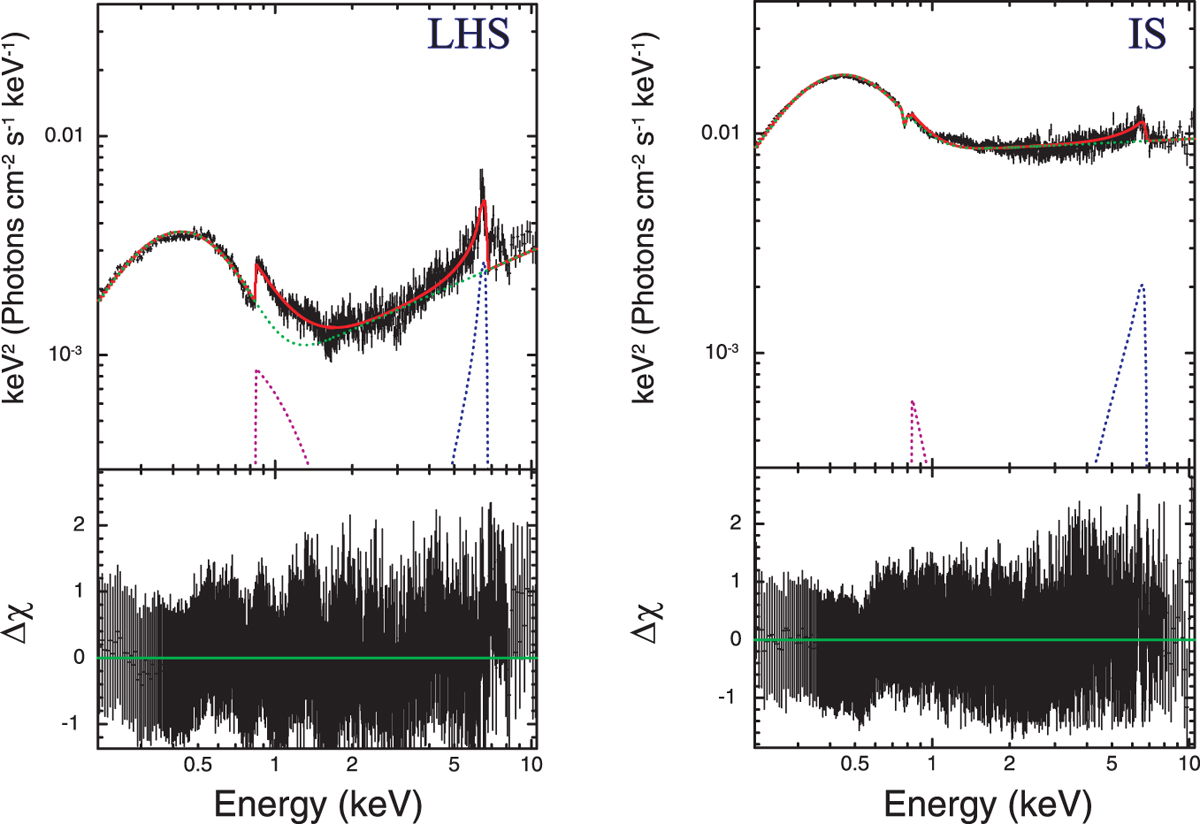
Representative EF(E) spectral diagrams for the low-hard state (left panel) and for the intermediate state (right panel). Dataare taken from the XMM-Newton observations 0157560101 (left panel, X2 data set), and 0109141401 (right panel, X1 data set). The data are shown by black crosses and the spectral model components are displayed by dashed green, purple and blue lines for the BMC, Laor, and redge components, respectively.
Current usage metrics show cumulative count of Article Views (full-text article views including HTML views, PDF and ePub downloads, according to the available data) and Abstracts Views on Vision4Press platform.
Data correspond to usage on the plateform after 2015. The current usage metrics is available 48-96 hours after online publication and is updated daily on week days.
Initial download of the metrics may take a while.