Fig. 9
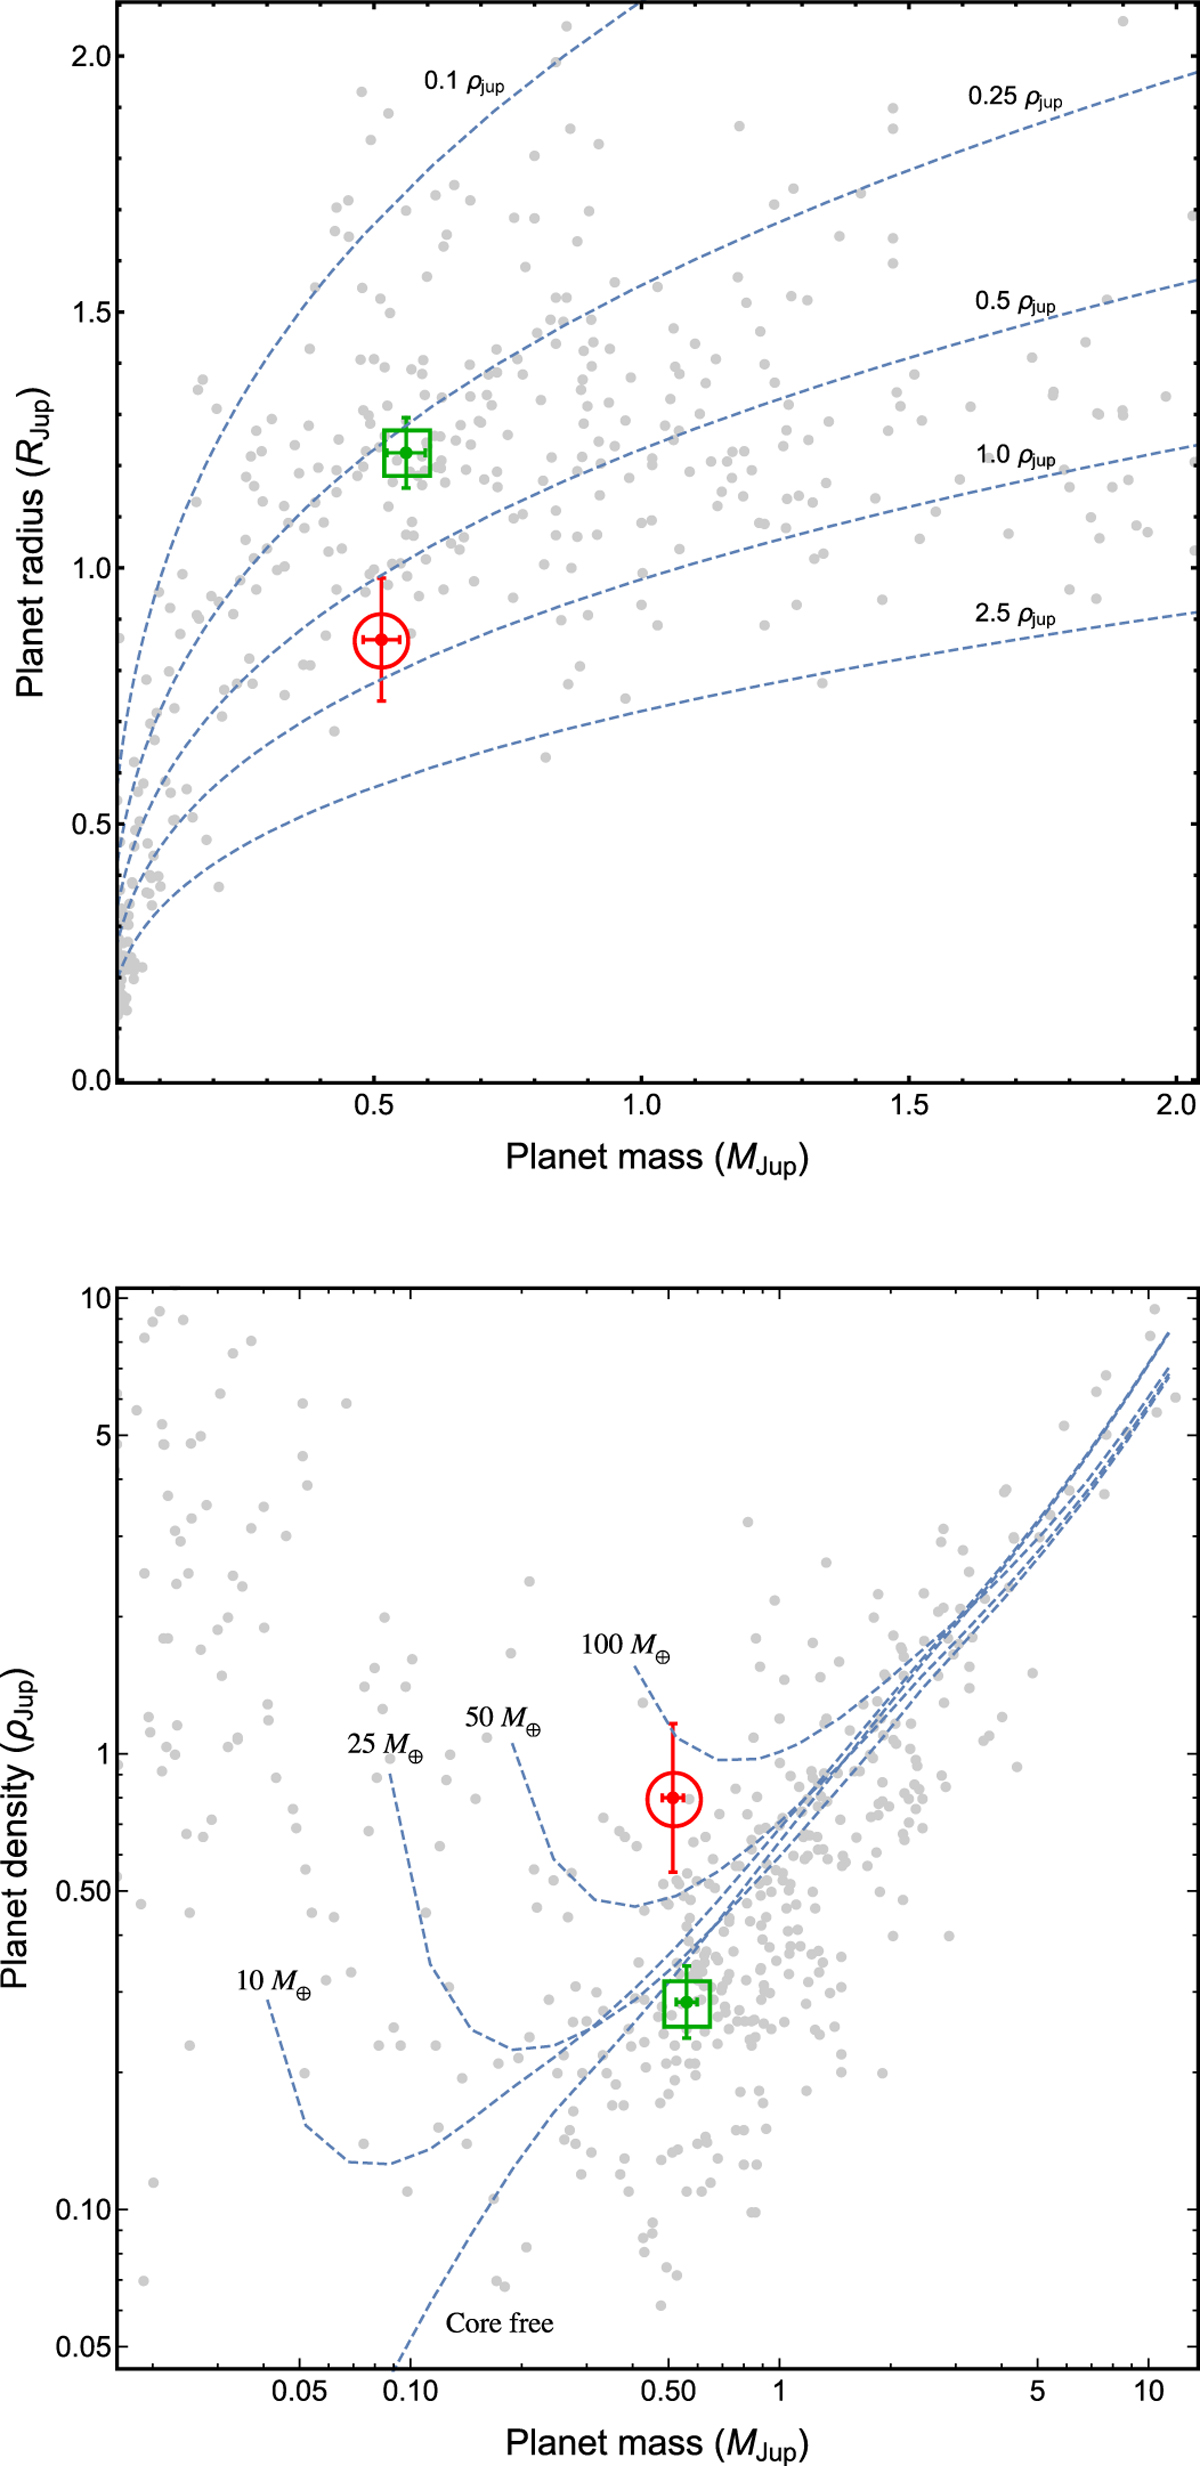
Mass–radius and mass–density diagrams for known transiting exoplanets. The positions of WASP-60 b are shown in the both panels with a green point in a box (this work) and a red point in a circle (Hébrard et al. 2013). The error bars are also illustrated. The grey points denote values taken from TEPCat and their error bars are suppressed for clarity. Top panel: a zoom of the mass–radius diagram of known transiting exoplanets. Dashed lines show where density is 2.5, 1.0, 0.5, 0.25, and 0.1 ρJup. Bottom panel: mass–density diagram of known transiting exoplanets. Dashed lines refer to four planetary models with various core masses and another one without a core (Fortney et al. 2007).
Current usage metrics show cumulative count of Article Views (full-text article views including HTML views, PDF and ePub downloads, according to the available data) and Abstracts Views on Vision4Press platform.
Data correspond to usage on the plateform after 2015. The current usage metrics is available 48-96 hours after online publication and is updated daily on week days.
Initial download of the metrics may take a while.