Fig. 6
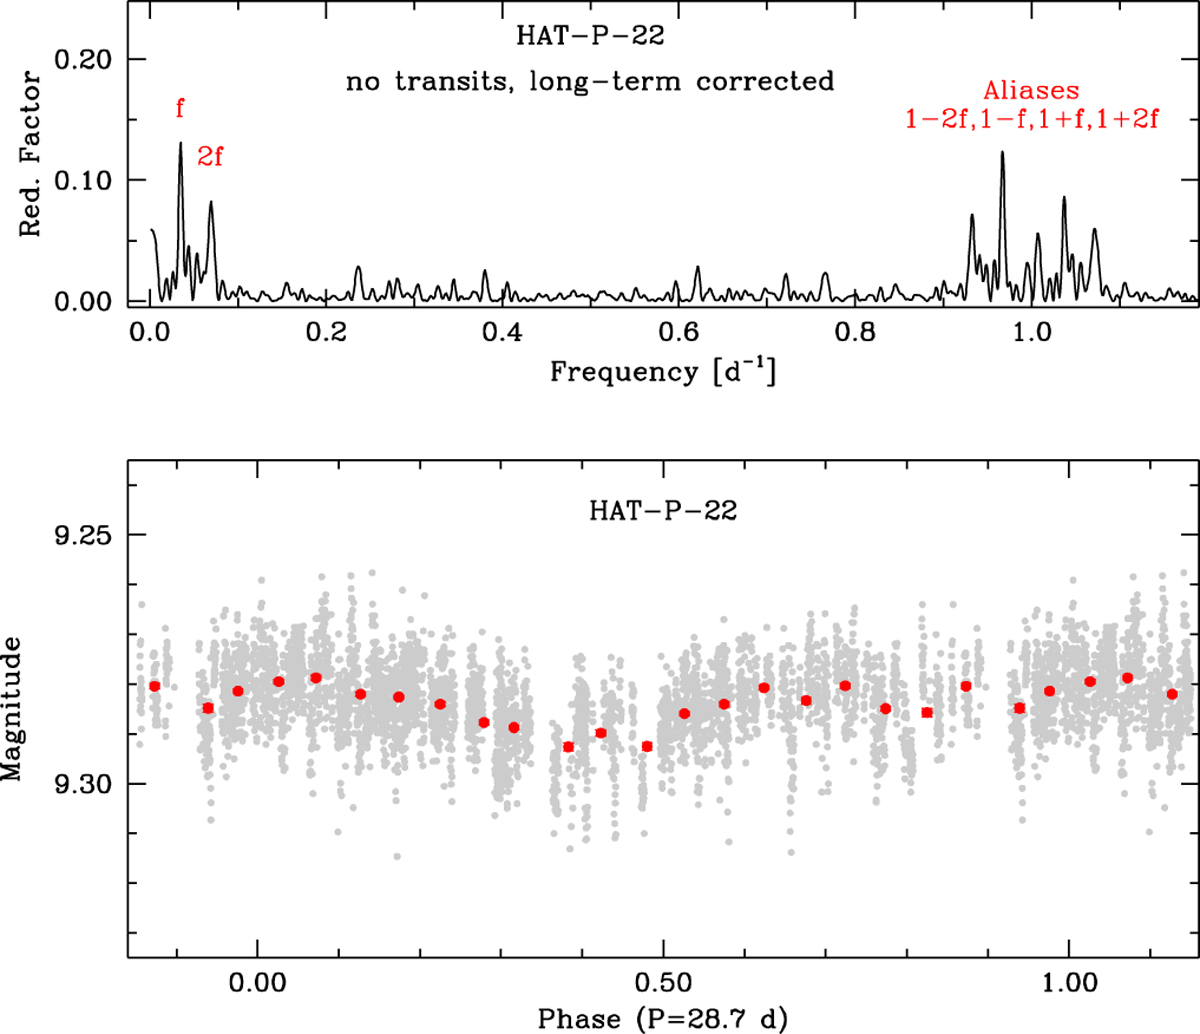
Detection of the rotational period of HAT-P-22. Top: power spectrum of the photometric measurements. The peaks corresponding to f = 0.0345 d−1, 2f, and their aliases are indicated. Bottom: photometric measurements (in grey) folded with P = 28.7 d. The error bars of the mean values of the binned data (red circles) have the same size of the points.
Current usage metrics show cumulative count of Article Views (full-text article views including HTML views, PDF and ePub downloads, according to the available data) and Abstracts Views on Vision4Press platform.
Data correspond to usage on the plateform after 2015. The current usage metrics is available 48-96 hours after online publication and is updated daily on week days.
Initial download of the metrics may take a while.