Free Access
Fig. 3
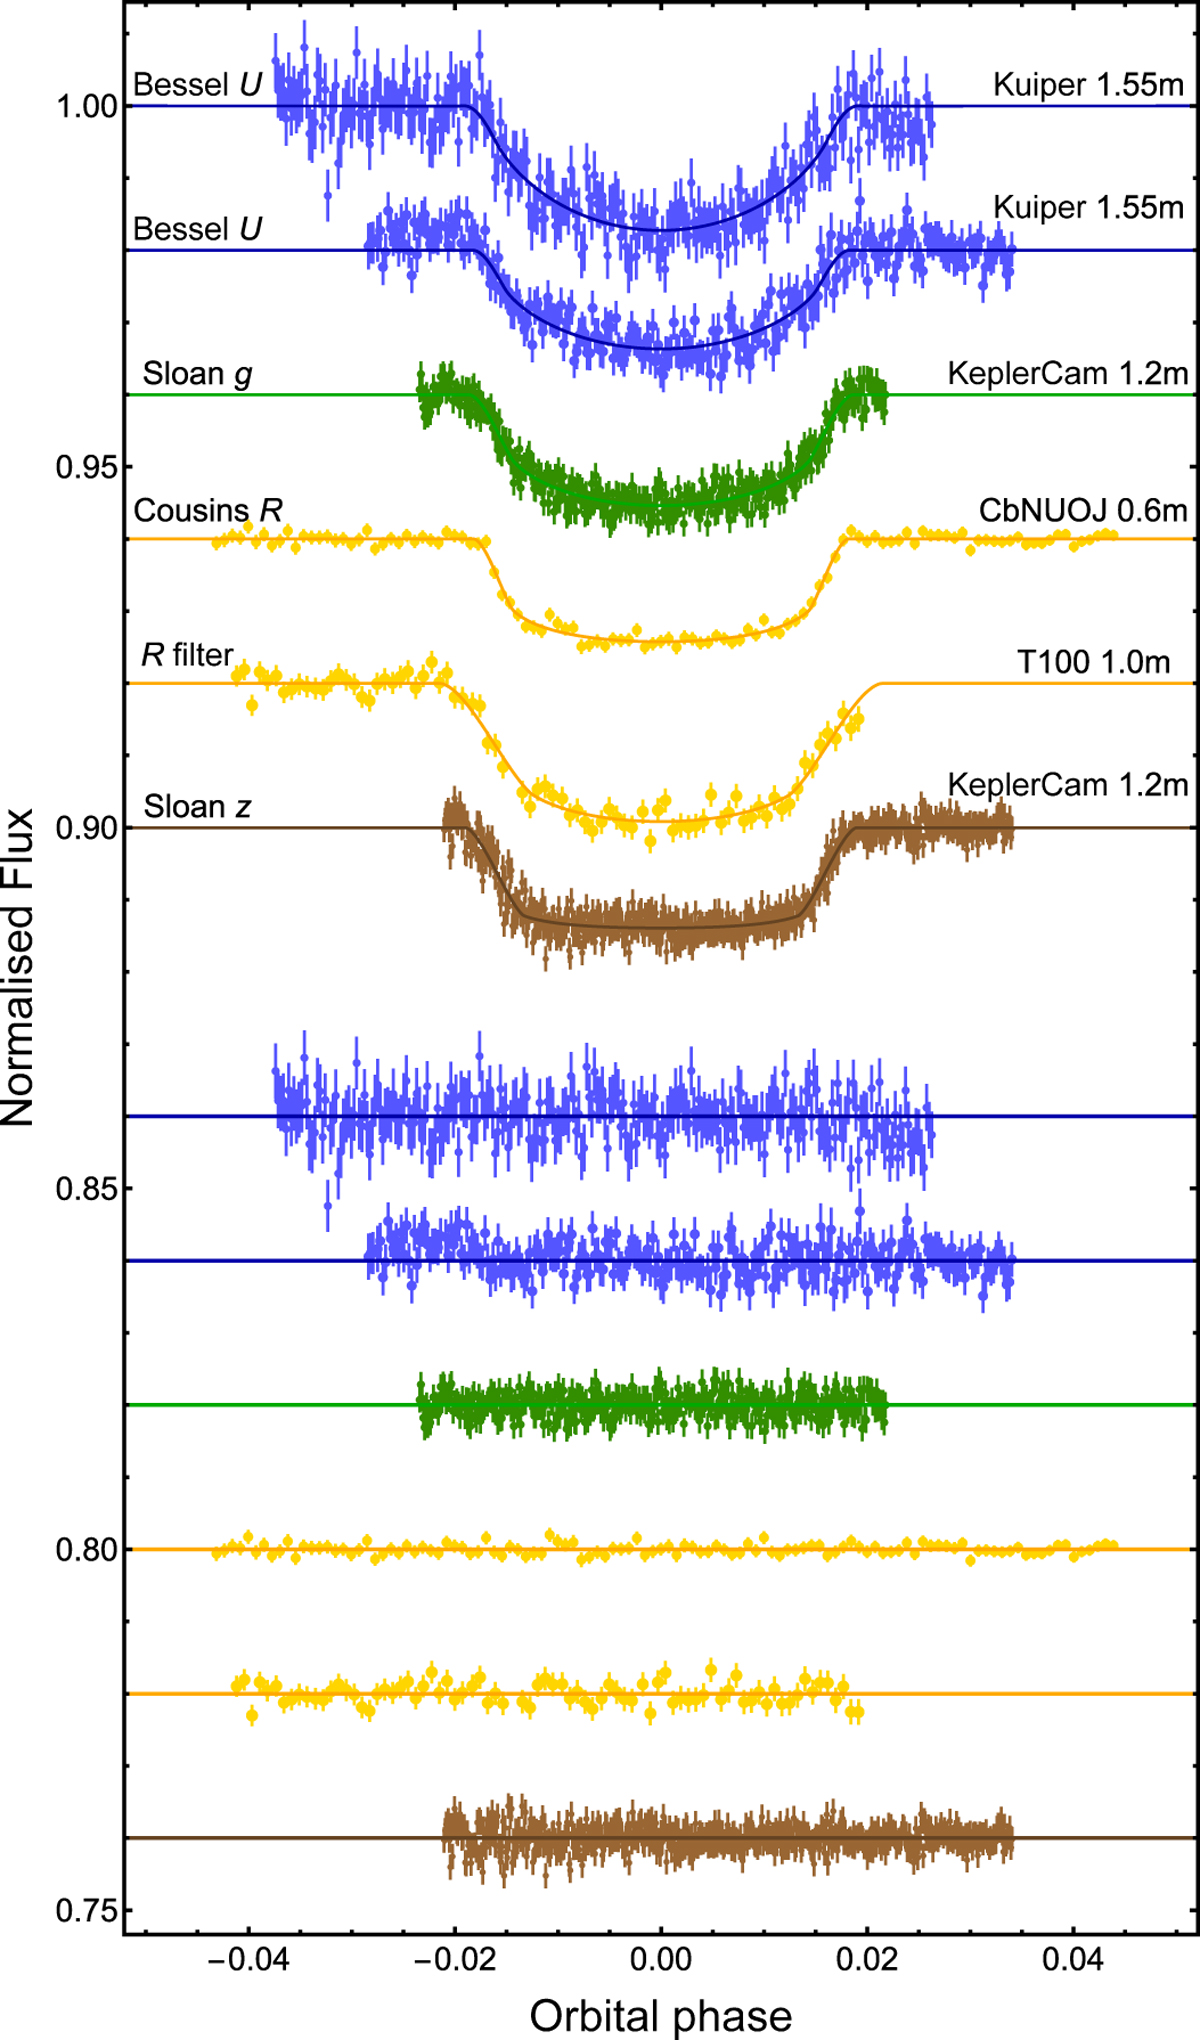
Phased light curves of HAT-P-22 b transits taken from the literature. These phased light curves are compared with the best JKTEBOP fits. The telescopes and filters related to the observation of each transit event are indicated. Residuals from the fitsare plotted at the base of the figure.
Current usage metrics show cumulative count of Article Views (full-text article views including HTML views, PDF and ePub downloads, according to the available data) and Abstracts Views on Vision4Press platform.
Data correspond to usage on the plateform after 2015. The current usage metrics is available 48-96 hours after online publication and is updated daily on week days.
Initial download of the metrics may take a while.