Fig. 10
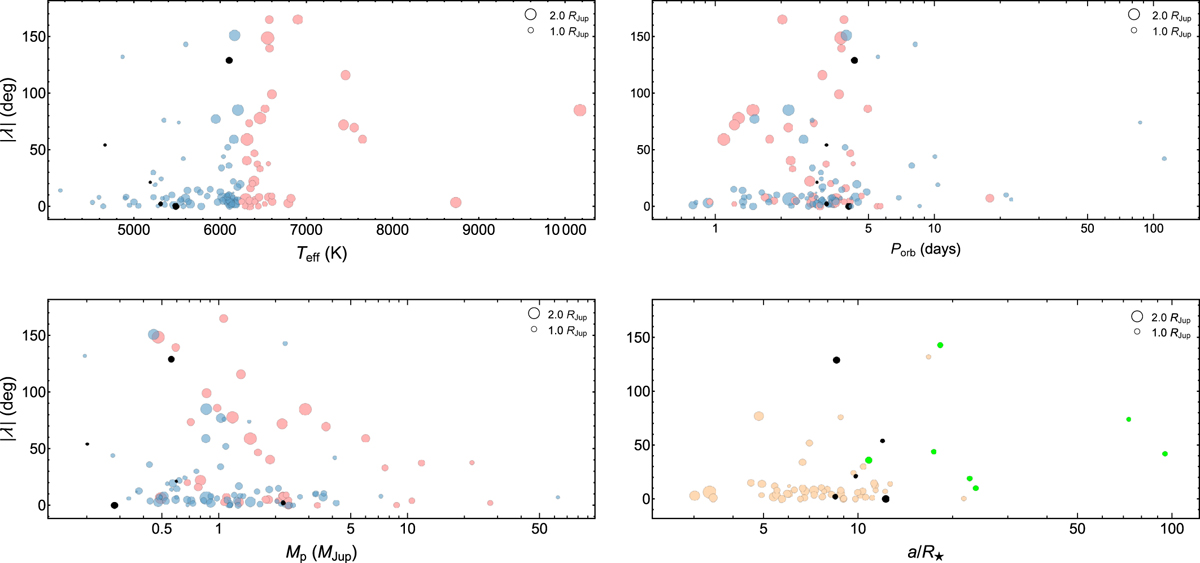
Sky-projected orbital obliquity as a function of several stellar, orbital, and planetary parameters. We only considered exoplanets with Rp > 0.8 RJup. The data are taken from TEPCat with the exception of the black points that indicate the five planetary systems examined in this work. Top left panel: value λ vs. the effective temperature of the parent stars. Blue (red) circles indicate systems in which the parent star has an effective temperature lower (higher) than 6250 K. The size of each circle is proportional to the corresponding planetary radius. The error bars are suppressed for clarity. Top right panel: value λ vs. the orbital period of the planets. The symbols are the same as in top left panel. Bottom left panel: value λ vs. the planet mass. The symbols are the same as in top left panel. Bottom right panel: value λ vs. the scaled orbital distance, a∕R⋆, for those systems with Teff < 6150 K (Anderson et al. 2015). The black and light orange circles represent planets with near-circular orbits (e < 0.1 or consistent with zero; Bonomo et al. 2017), while the green circles depict eccentric orbits (e ≥ 0.1).
Current usage metrics show cumulative count of Article Views (full-text article views including HTML views, PDF and ePub downloads, according to the available data) and Abstracts Views on Vision4Press platform.
Data correspond to usage on the plateform after 2015. The current usage metrics is available 48-96 hours after online publication and is updated daily on week days.
Initial download of the metrics may take a while.