| Issue |
A&A
Volume 613, May 2018
|
|
|---|---|---|
| Article Number | A19 | |
| Number of page(s) | 4 | |
| Section | Astrophysical processes | |
| DOI | https://doi.org/10.1051/0004-6361/201732208 | |
| Published online | 25 May 2018 | |
Orbit and intrinsic spin-up of the newly discovered transient X-ray pulsar Swift J0243.6+6124
1
Institut für Astronomie und Astrophysik,
Sand 1,
72076
Tübingen, Germany
e-mail: This email address is being protected from spambots. You need JavaScript enabled to view it.
2
Tuorla Observatory, Department of Physics and Astronomy, University of Turku,
Väisäläntie 20,
21500
Piikkiö, Finland
3
Space Research Institute of the Russian Academy of Sciences,
Profsoyuznaya Str. 84/32,
Moscow
117997, Russia
Received:
30
October
2017
Accepted:
19
December
2017
Abstract
We present the orbital solution for the newly discovered transient Be X-ray binary Swift J0243.6+6124 based on the data from the gamma-ray burst monitor on board Fermi obtained during the October 2017 outburst. We model the Doppler induced and intrinsic spin variations of the neutron star assuming that the latter is driven by accretion torque, and we discuss the implications of the observed spin variations for the parameters of the neutron star and the binary. In particular, we conclude that the neutron star must be strongly magnetized, and estimate the distance to the source at ~5 kpc.
Key words: stars: neutron / X-rays: binaries
© ESO 2018
1 Introduction
The transient X-ray source Swift J0243.6+6124 was first detected by Swift/BAT on October 3, 2017 (Kennea et al. 2017). Pulsations with period ~ 9.86 s detected by Swift/XRT and Fermi/GBM (Jenke & Wilson-Hodge 2017), together with the transient behavior and tentative optical counterpart classification (Kouroubatzakis et al. 2017), suggest that it is a new Galactic Be X-ray transient.
Indeed, the follow-up NuSTAR observations on October 5, 2017 (Bahramian et al. 2017), revealed a cutoff power-law spectrum typical for Be transients, with a flux of ~8.7 × 10⁻⁹ erg cm−2 s−1. No significant spectral features, such as a cyclotron line (Bahramian et al. 2017), could be identified in the broadband spectrum of the source, so no estimate of the magnetic field strength of the neutron star could be obtained.
The outburst reached peak flux of ~9 Crab level and is still ongoing. The spin evolution of the source is being monitored by Fermi/GBM and appears to be mostly driven by Doppler induced variations due to the orbital modulation. Here we report the first orbital solution for the system based on the GBM data, and briefly discuss the implications of the observed intrinsic spin variations for the basic parameters of the system.
2 Data analysis and results
The analysis presented below is based on the spin history of the source provided by Fermi/GBM pulsar project1 from MJD 58 027 to MJD 58 084. A visual inspection of the spin evolution (see Fig. 1) already suggests that despite the apparently high accretion rate it is modulated by orbital motion rather than intrinsic spin-up of the pulsar. Still, the intrinsic spin-up is important and it is essential to model it accurately in order to recover the orbital modulation of the spin frequency and thus orbital parameters of the binary.
To obtain the orbital solution we initially used the same technique as Tsygankov et al. (2017) and Sugizaki et al. (2017). We found, however, that for Swift J0243.6+6124 it yields unsatisfactory results, due to the large model systematic discussed in Tsygankov et al. (2017). Indeed, the observed frequency at each moment is obtained by integration of the intrinsic spin-up rate predicted by the torque model, which inevitably depends on the accretion rate. The uncertainty of the observed flux translates thus to a systematic uncertainty in predicted frequency that accumulates over time. In the case of Swift J0243.6+6124, it appeared excessively large, which led to the overestimation of the uncertainties for the orbital parameters. To overcome this problem, we implemented here a more direct approach that does not involve integration of the accretion rate. In particular, we fit the instantaneous spin frequency derivative rather than the observed spin frequency (similarly to Sanna et al. 2017). The spin-up rate and its uncertainty can be estimated directly from the comparison of the frequencies measured in consequent time intervals (propagating the uncertainties). The estimated frequency derivatives are then ascribed to the midpoint between respective time intervals. The results are presented in Fig. 1 where additional model systematic accounting for the uncertainty in the accretion rate is added in quadrature (see below).
The observed frequency variations are caused by a combination of Doppler shifts due to the orbital motion and the intrinsic spin-up of the neutron star. The radial velocity and thus the frequency change rate due to the orbital motion of the pulsar can be unambiguously calculated for any assumed orbit by solving the Kepler equation, which we do numerically following the equations in Hilditch (2001). On the other hand, the intrinsic spin-up rate of the neutron star is expected to be a function of accretion rate and can be calculated assuming a model for the accretion torque. In particular, we assume thatthe intrinsic spin evolution is driven by the accretion torque exerted by a thin threaded accretion disk, and is described by the model by Ghosh & Lamb (1979). The model parameters are the mass, the radius, and the magnetic field of the neutron star, and the accretion rate. We use standard neutron star mass and radius (R = 10 km, M = 1.4 M⊙), and consider magnetic field as a free parameter.
The accretion luminosity can be estimated based on the observed flux. While it is possible to use pulsed flux measured by GBM in 12–50 keV as a proxy, we found that non-pulsed flux measured by Swift/BAT in the 15–50 keV range (Krimm et al. 2013)is a better tracer of the bolometric flux. To convert the observed count rate to flux, we first cleaned the artifact dips from the survey light curve and rebinned it to match the time intervals used by the GBM. The resulting light curve was then scaled using the broadband fluxes estimated from NuSTAR spectra of the source observed on MJD 58 031.7, 58 057.3, 58 067.1 assuming the same model as Bahramian et al. (2017). To obtain the spectra we mostly followed the standard data reduction procedures described in the NuSTAR user guide. Taking into accountthe source brightness, we opted, however, for slightly larger than recommended extraction radius of 120′′. Furthermore, for the two observations close to the peak of the outburst, standard screening criteria had to be relaxed by setting the statusexpr parameter to “b0000xx00xx0xx000” to avoid misidentification of source counts as flickering pixels as described in Walton et al. (2017).
We then estimated the bolometric flux from the spectral fit in 3–80 ke V energy range at Fx ~ 9.3 × 10⁻⁹, 1.72 × 10⁻⁷, and 2.56 × 10⁻⁷ erg cm−2 s−1 for the three observations. Comparison with the contemporary BAT count rates implies then a 1.54(3) × 10−7 erg cm−2 count−1 conversion factor. The scaled light curve is presented in Fig. 1 with error bars including the uncertainty in the conversion factor. We also verified that the estimated flux agrees with the flux measured by the MAXI monitor (Matsuoka et al. 2009). Using the daily spectra of the source extracted using the on-demand process provided by the MAXI team2, and the same spectral model as above, we calculated the bolometric fluxes. The resulting light curve indeed was found to agree with the scaled Swift/BAT flux as shown in Fig. 1. Since MAXI only observed part of the outburst, we use the Swift/BAT flux below to calculate the accretion luminosity for any assumed distance d, which we consider a free parameter.
The other five parameters of the final model combining the intrinsic spin-up and that induced by the orbital motion are orbital parameters of the system, i.e., the orbital period Porb, the projection of the semimajor axis asini, the eccentricity e, the longitude of periastron ω, and the periastron time TPA. Statistical uncertainties in the observed flux might affect the predicted accretion torque, so for the final fit and the calculation of the uncertainties for the best-fit parameters, we include it as additional model systematics, which is calculated by the propagation of the observed flux uncertainties based on the best-fit model obtained without inclusion of the systematics.
The best-fit results are presented in Table 1 and Fig. 1 where the contribution of intrinsic accretion-driven spin-up and of the orbital motion to the observed frequency derivative are also shown. The obtained parameters are similar to values reported by Ge et al. (2017) and the Fermi/GBM pulsar project. The semimajor axis is, however, somewhat larger for our solution, which is likely related to the difference in estimated bolometric fluxes.
We note the low eccentricity of the orbit (for a BeXRB) and comparatively short orbital period. These, together with the high brightness of the source suggest that it undergoes a giant rather than normal outburst. The obtained estimates for the distance to the source and magnetic field depend on the assumed torque model. The orbital parameters are also affected to some extent. The quoted uncertainties only reflect the statistical uncertainties of the observed spin-up rates and fluxes, and do not account for systematic associated with the choice of the torque model. We note, however, that this is a general problem for X-ray pulsar timing as the intrinsic spin-up must be modeled in any case, and using a realistic approximation for torque affecting the neutron star instead of the more commonly used polynomial approximation is more reliable.
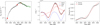 |
Fig. 1 Left panel: bolometric light curve obtained by scaling the Swift/BAT 15–50 keV count rate (black error bars) to match the broadband flux observed by NuSTAR (red circles). The flux derived from MAXI spectra is also shown for reference (green circles). Middle panel: observed spin frequency period derivative reconstructed as described in the text (points) andused to determine the orbital parameters of the system. The best-fit model for the intrinsic (thin red line), orbital-induced (thin blue line), and total (thick red) frequency derivative components are also shown. Right panel: spin frequencies as reported by GBM pulsar project (black) and orbital motion corrected using the best-fit ephemeris (red). |
Best-fit orbital parameters of Swift J0243.6+6124.
3 Discussion and conclusions
The intrinsic spin evolution of the neutron star is recovered as part of the determination of the orbital parameters. It is interesting, therefore, to discuss which implications the observed spin-up rate might have for the basic parameters of the neutron star and thebinary under various assumptions on the accretion torque. For instance, it is possible to deduce the lower limit on accretion rate neglecting the magnetic braking torque and assuming that the pulsar is spun up with the highest possible rate (Lipunov 1981; Scott et al. 1997),
 where Ṁ17 is the accretion rate in units of 1017 g s−1, ν is spin frequency, and I45 and M1.4 are respectively the momentum of inertia and mass of the neutron star in units of 1045 g cm2 and 1.4 M⊙. For the maximum observed intrinsic spin-up rate of (
 Hz s−1), this implies Lx ≥ GMNSṀ∕R ~ 8.4 × 1038 erg s−1, which is far above the Eddington limit and approaches the levels observed in ultraluminous X-ray sources.
The observed bolometric flux corresponding to the maximum observed spin-up rate is Fx ~ 2.8 × 10⁻⁷ erg cm−2 s−1, which implies a distance to the source of ≳5 kpc. We note that this limit is fairly robust as the observed spin-up rate is only weakly affected by the uncertainty in orbital parameters, and the corresponding broadband flux is well constrained.
The distance and the magnetic field of the neutron star are already estimated as part of the orbit determination assuming the Ghosh & Lamb (1979) model for torques. However, for illustration it is also useful to compare the intrinsic spin-up rate directly with the prediction of the model. Using the spin frequencies corrected for orbital motion as presented in Fig. 1, we calculated the intrinsic spin-up rate using the same approach as above. We note that the correlation of the spin-up rate with flux is indeed apparent as shown in Fig. 2. Furthermore, the source appears to spin down at lower fluxes, i.e., the braking torque is actually non-negligible, and the limit on the accretion rate obtained above is indeed only a lower limit.
We considered torque models by Ghosh & Lamb (1979), Lipunov (1981), Wang (1987), and Parfrey et al. (2016) to estimate the magnetic field of the neutron star and the accretion rate. For all models one of the most important parameters is the inner radius of the accretion disk Rd = kRA, expressed as a fraction of the Alfvénic radius. We assumed it to be k = 0.5 for consistency (since k ~ 0.5 in the Ghosh & Lamb 1979 model). It is important to note that this assumption is arbitrary to some extent; however, the k value mostly affects the estimated magnetic field rather than distance. Other parameters (besides the field strength and the accretion rate depending on distance) were kept free. In the Ghosh & Lamb (1979) and Wang (1987) models, both field and accretion rate are well constrained mainly because the inner radius is tied to the magnetosphere size and fully defines the accretion torque (i.e., the distance and field strength are the only parameters that affect it). The magnetosphere can be neither too small (which would imply excessively strong spin-up at high luminosities) nor too large (as that would inhibit accretion at low luminosities), so both the field and the accretion rate (and hence distance) are formally well constrained.
If the coupling radius is considered a free parameter, the magnetic field becomes correlated with k and is thus poorly constrained. The Lipunov (1981) and Parfrey et al. (2016) models also contain additional parameters characterizing the efficiency of angular momentum transfer, so without additional assumptions the field and distance to the source cannot be constrained simultaneously, and only the lower limit on the distance discussed above holds (because the accretion torque is the same in all models). A high accretion rate implying a distance in excess of ~ 5 kpc and strong field in excess of ~1013 G are therefore required regardless of the torque model and model parameters.
We conclude, therefore, that the source must be located farther than ~ 5 kpc assuming the standard neutron star parameters. We note that this is a factor of two higher than the distance estimated from the photometry of the optical counterpart (Bikmaev et al. 2017). The origin of this discrepancy is not yet clear, and a detailed investigation of the properties of the optical companion is ongoing. It is important to emphasize, however, that the spin-up rate of the neutron star is well constrained, and it is highly unlikely that we significantly underestimate the accretion rate based on the observed bolometric source flux, so the pulsar must indeed be farther away than suggested by Bikmaev et al. (2017) unless the neutron star has a much lower momentum of inertia than usually assumed, which is unlikely. Weanticipate that this discrepancy will be ultimately resolved with the next data release of the Gaia mission.
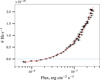 |
Fig. 2 Intrinsic spin frequency derivative reconstructed from the corrected values and best fit with the Ghosh & Lamb (1979) model. |
Acknowledgements
This work is based on spin histories provided by the Fermi GBM pulsar project. This research has made use of MAXI data provided by RIKEN, JAXA, and the MAXI team. V.D. and A.S. thank the Deutsches Zentrum for Luft- und Raumfahrt (DLR) and Deutsche Forschungsgemeinschaft (DFG) for financial support. S.T. acknowledges support by the Russian Scientific Foundation grant 14-12-01287. This research has made use of data and/or software provided by the High Energy Astrophysics Science Archive Research Center (HEASARC), which is a service of the Astrophysics Science Division at NASA/GSFC and the High Energy Astrophysics Division of the Smithsonian Astrophysical Observatory.
References
- Bahramian, A., Kennea, J. A., & Shaw, A. W. 2017, ATel, 10866 [Google Scholar]
- Bikmaev, I., Shimansky, V., Irtuganov, E., et al. 2017, ATel, 10968 [Google Scholar]
- Ge, M., Zhang, S., Lu, F., et al. 2017, ATel, 10907 [Google Scholar]
- Ghosh, P., & Lamb, F. K. 1979, ApJ, 234, 296 [NASA ADS] [CrossRef] [Google Scholar]
- Hilditch, R. W. 2001, An Introduction to Close Binary Stars (Cambridge, UK: Cambridge University Press) [CrossRef] [Google Scholar]
- Jenke, P., & Wilson-Hodge, C. A. 2017, ATel, 10812 [Google Scholar]
- Kennea, J. A., Lien, A. Y., Krimm, H. A., Cenko, S. B., & Siegel, M. H. 2017, ATel, 10809 [Google Scholar]
- Kouroubatzakis, K., Reig, P., Andrews, J., & Zezas, A. 2017, ATel, 10822 [Google Scholar]
- Krimm, H. A., Holland, S. T., Corbet, R. H. D., et al. 2013, ApJS, 209, 14 [NASA ADS] [CrossRef] [Google Scholar]
- Lipunov, V. M. 1981, Sov. Astron., 25, 375 [NASA ADS] [Google Scholar]
- Matsuoka, M., Kawasaki, K., Ueno, S., et al. 2009, PASJ, 61, 999 [NASA ADS] [CrossRef] [Google Scholar]
- Parfrey, K., Spitkovsky, A., & Beloborodov, A. M. 2016, ApJ, 822, 33 [NASA ADS] [CrossRef] [Google Scholar]
- Sanna, A., Riggio, A., Burderi, L., et al. 2017, MNRAS, 469, 2 [NASA ADS] [CrossRef] [Google Scholar]
- Scott, D. M., Finger, M. H., Wilson, R. B., et al. 1997, ApJ, 488, 831 [NASA ADS] [CrossRef] [Google Scholar]
- Sugizaki, M., Mihara, T., Nakajima, M., & Makishima, K. 2017, PASJ, 69, 100 [NASA ADS] [CrossRef] [Google Scholar]
- Tsygankov, S. S., Doroshenko, V., Lutovinov, A. A., Mushtukov, A. A., & Poutanen, J. 2017, A&A, 605, A39 [NASA ADS] [CrossRef] [EDP Sciences] [Google Scholar]
- Walton, D. J., Mooley, K., King, A. L., et al. 2017, ApJ, 839, 110 [NASA ADS] [CrossRef] [Google Scholar]
- Wang, Y.-M. 1987, A&A, 183, 257 [NASA ADS] [Google Scholar]
All Tables
All Figures
|
Fig. 1 Left panel: bolometric light curve obtained by scaling the Swift/BAT 15–50 keV count rate (black error bars) to match the broadband flux observed by NuSTAR (red circles). The flux derived from MAXI spectra is also shown for reference (green circles). Middle panel: observed spin frequency period derivative reconstructed as described in the text (points) andused to determine the orbital parameters of the system. The best-fit model for the intrinsic (thin red line), orbital-induced (thin blue line), and total (thick red) frequency derivative components are also shown. Right panel: spin frequencies as reported by GBM pulsar project (black) and orbital motion corrected using the best-fit ephemeris (red). |
| In the text | |
|
Fig. 2 Intrinsic spin frequency derivative reconstructed from the corrected values and best fit with the Ghosh & Lamb (1979) model. |
| In the text | |
Current usage metrics show cumulative count of Article Views (full-text article views including HTML views, PDF and ePub downloads, according to the available data) and Abstracts Views on Vision4Press platform.
Data correspond to usage on the plateform after 2015. The current usage metrics is available 48-96 hours after online publication and is updated daily on week days.
Initial download of the metrics may take a while.