Fig. 1
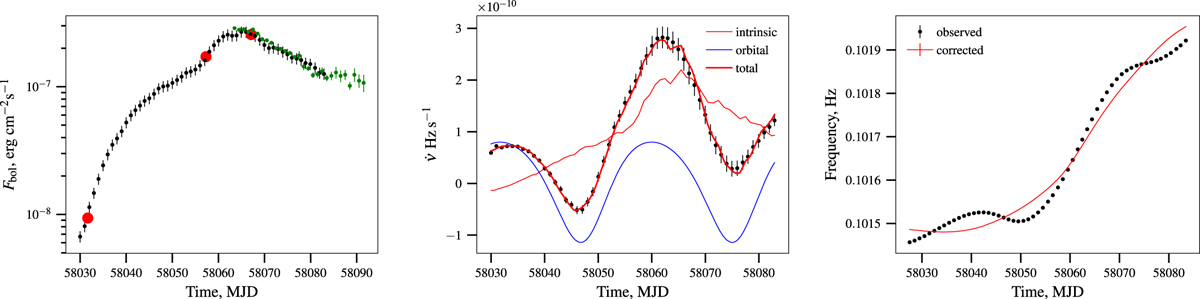
Left panel: bolometric light curve obtained by scaling the Swift/BAT 15–50 keV count rate (black error bars) to match the broadband flux observed by NuSTAR (red circles). The flux derived from MAXI spectra is also shown for reference (green circles). Middle panel: observed spin frequency period derivative reconstructed as described in the text (points) andused to determine the orbital parameters of the system. The best-fit model for the intrinsic (thin red line), orbital-induced (thin blue line), and total (thick red) frequency derivative components are also shown. Right panel: spin frequencies as reported by GBM pulsar project (black) and orbital motion corrected using the best-fit ephemeris (red).
Current usage metrics show cumulative count of Article Views (full-text article views including HTML views, PDF and ePub downloads, according to the available data) and Abstracts Views on Vision4Press platform.
Data correspond to usage on the plateform after 2015. The current usage metrics is available 48-96 hours after online publication and is updated daily on week days.
Initial download of the metrics may take a while.