Fig. 7
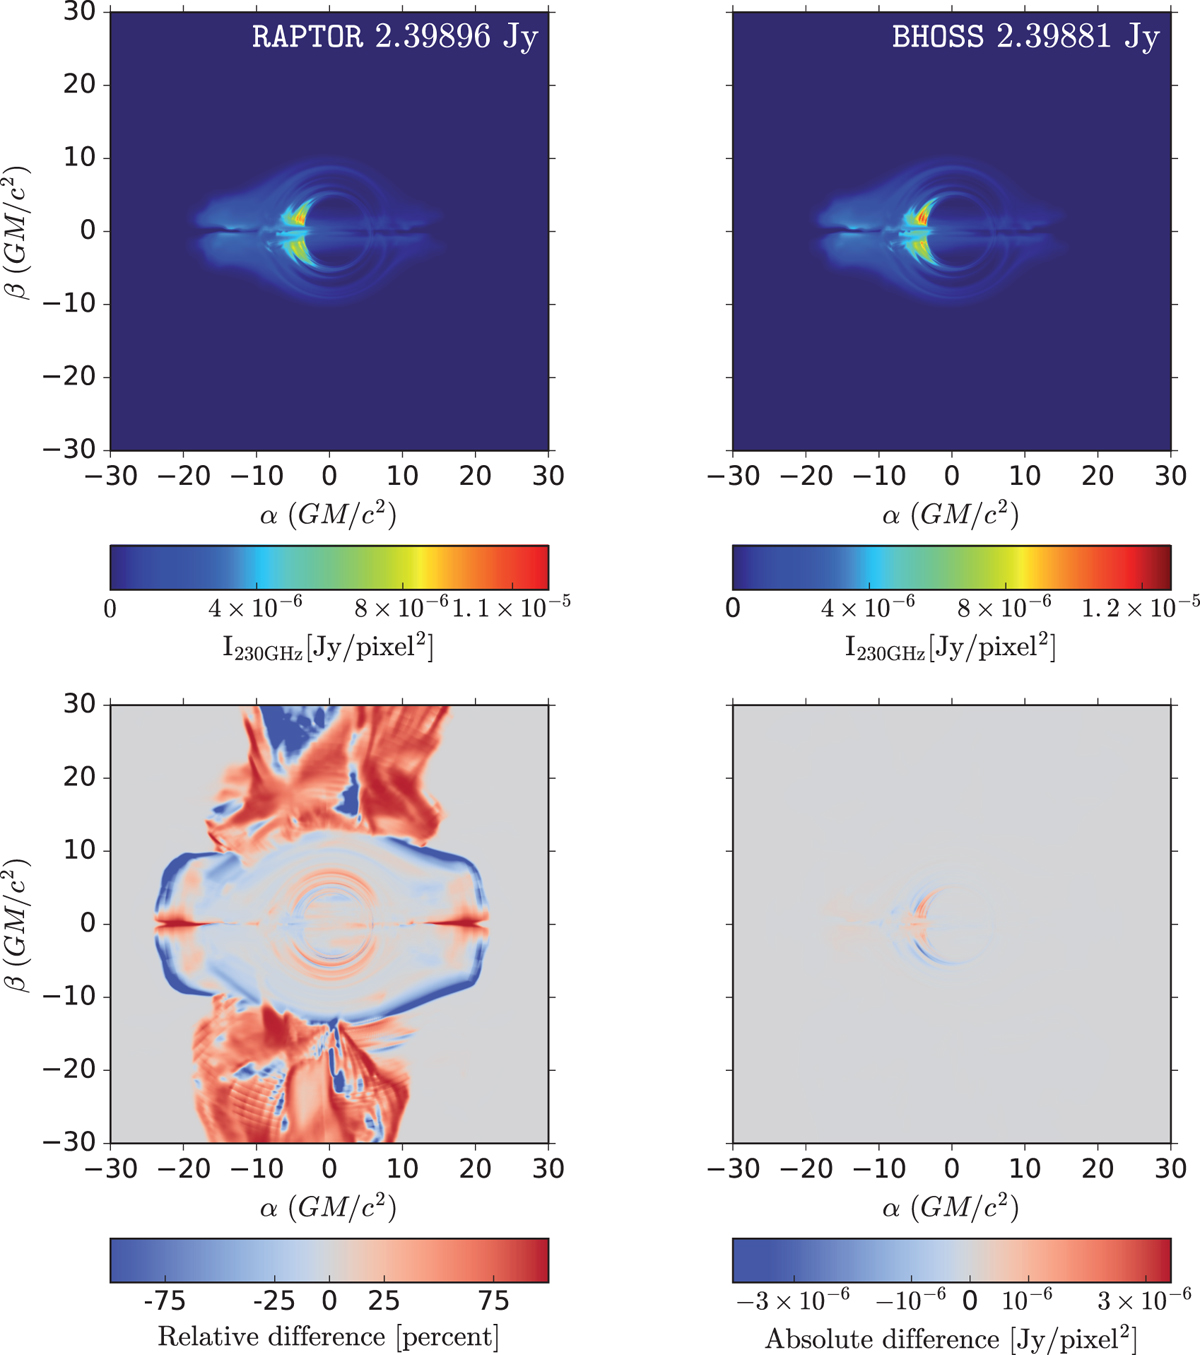
Intensity maps at 230 GHz for the comparison test, with a resolution of 4096 × 4096 pixels. The RAPTOR output (top left panel) and BHOSS output (top right panel) show excellent agreement in total flux density. The relative difference between the output of both codes is plotted in the bottom left panel. The deviations become quite large in the periphery of the image; since the intensity in these regions is low, however, they do not contribute significantly to the integrated flux density, as can be seen in the absolute difference between the two codes (bottom right panel).
Current usage metrics show cumulative count of Article Views (full-text article views including HTML views, PDF and ePub downloads, according to the available data) and Abstracts Views on Vision4Press platform.
Data correspond to usage on the plateform after 2015. The current usage metrics is available 48-96 hours after online publication and is updated daily on week days.
Initial download of the metrics may take a while.