Fig. 4
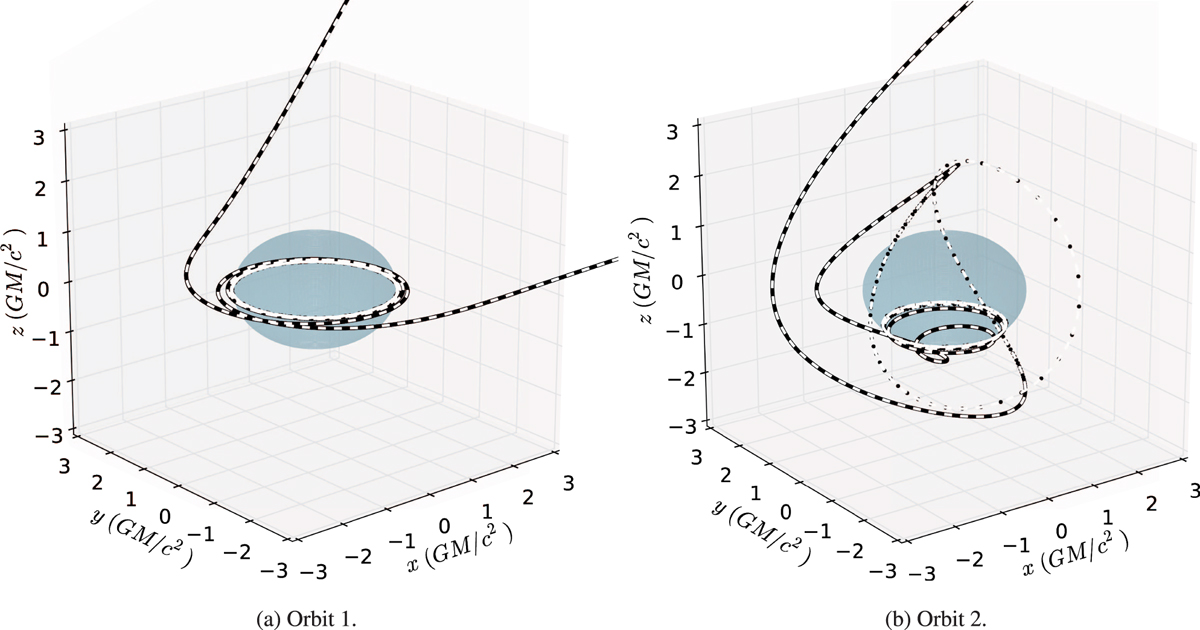
Comparison of null geodesics computed by the semi-analytical integrator geokerr to those computed by our fully numerical code. In each case, the geodesic represented by the black dots was computed using geokerr while the geodesic represented by the white dotted line is the output of RAPTOR (dots were chosen for the former geodesic because its variable step-size can otherwise create interpolation issues). The gray spheroid represents the black hole’s outer event horizon. MKS coordinates were used with ϵ = 0.001. The parameters for these geodesics are listed in Table 1.
Current usage metrics show cumulative count of Article Views (full-text article views including HTML views, PDF and ePub downloads, according to the available data) and Abstracts Views on Vision4Press platform.
Data correspond to usage on the plateform after 2015. The current usage metrics is available 48-96 hours after online publication and is updated daily on week days.
Initial download of the metrics may take a while.