Fig. 15
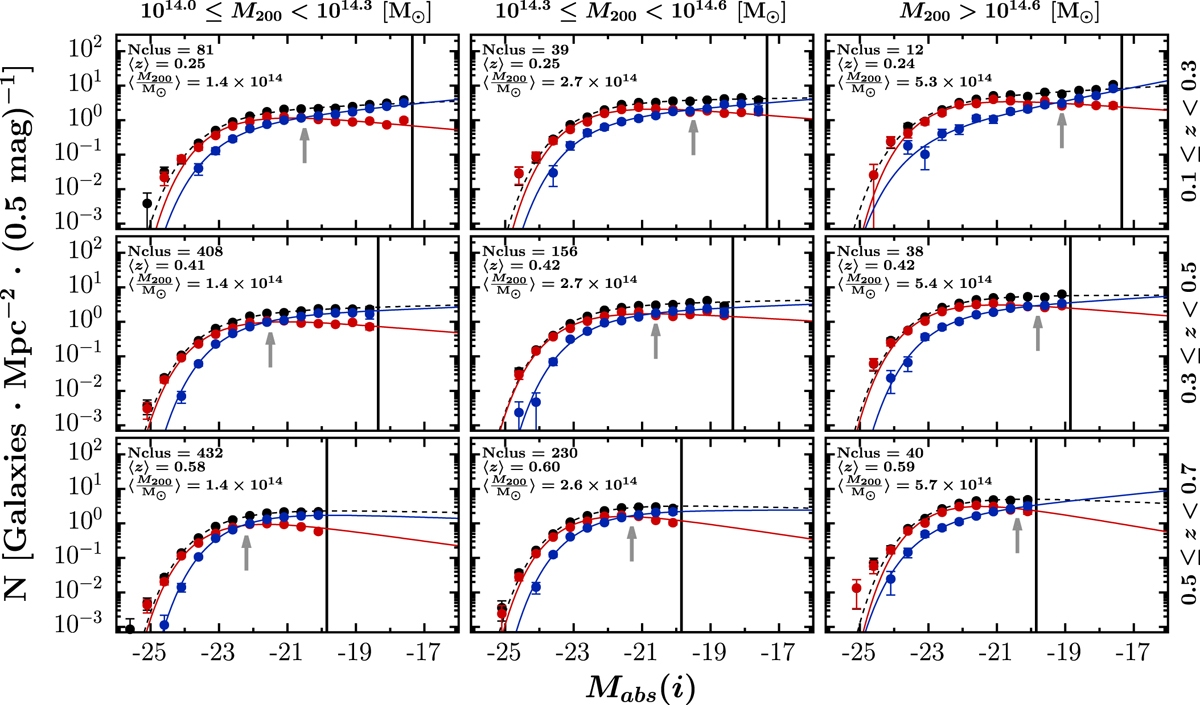
Redshift and mass co-evolution of the i-band stacked GLFs in the W1 field of the CFHTLS in bins of mass and redshift. Black is for all galaxies, red for ETGs, and blue for LTGs. Indicated in each panel are the mean redshift and mass, and the number of cluster candidates in the bin. The black vertical line indicates the limiting magnitude used in the fit. The grey arrows indicate the absolute magnitudes where the GLFs of the ETGs and LTGs intersect.
Current usage metrics show cumulative count of Article Views (full-text article views including HTML views, PDF and ePub downloads, according to the available data) and Abstracts Views on Vision4Press platform.
Data correspond to usage on the plateform after 2015. The current usage metrics is available 48-96 hours after online publication and is updated daily on week days.
Initial download of the metrics may take a while.