Free Access
Fig. 5
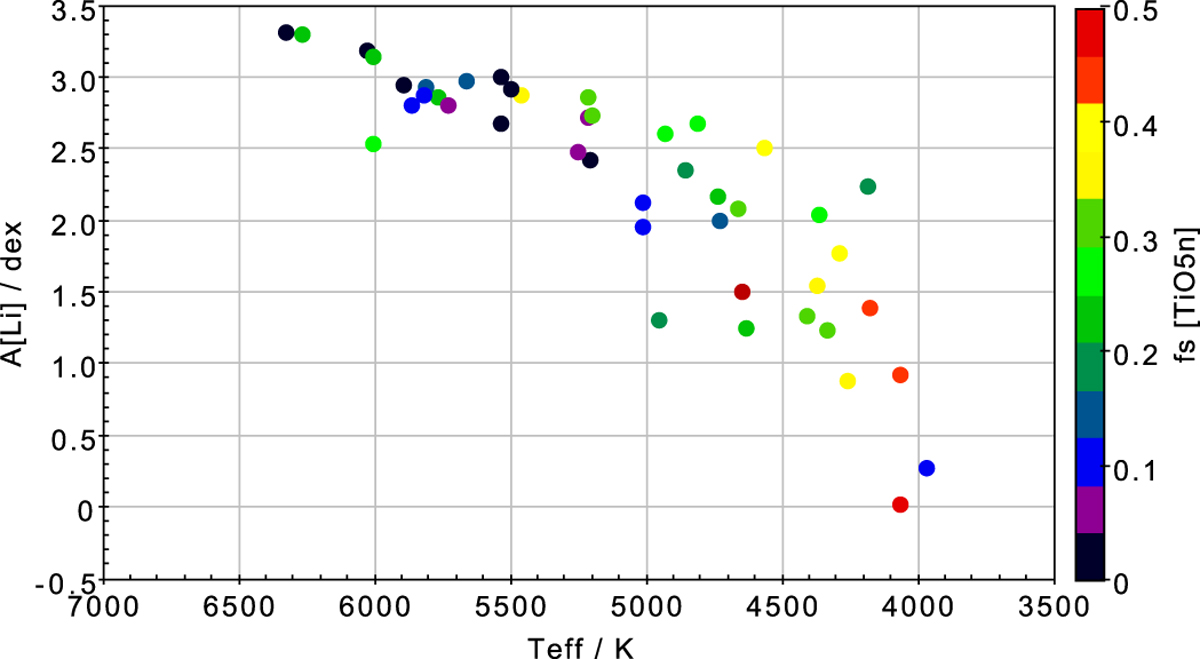
As in Fig. 3 except that the color-code now reflects the spot filling factor at the stellar surface, spectroscopically derived from the depth of TiO molecular bands by Fang et al. (2016). The color-scale is given on the right side of the plot.
Current usage metrics show cumulative count of Article Views (full-text article views including HTML views, PDF and ePub downloads, according to the available data) and Abstracts Views on Vision4Press platform.
Data correspond to usage on the plateform after 2015. The current usage metrics is available 48-96 hours after online publication and is updated daily on week days.
Initial download of the metrics may take a while.