Fig. 8
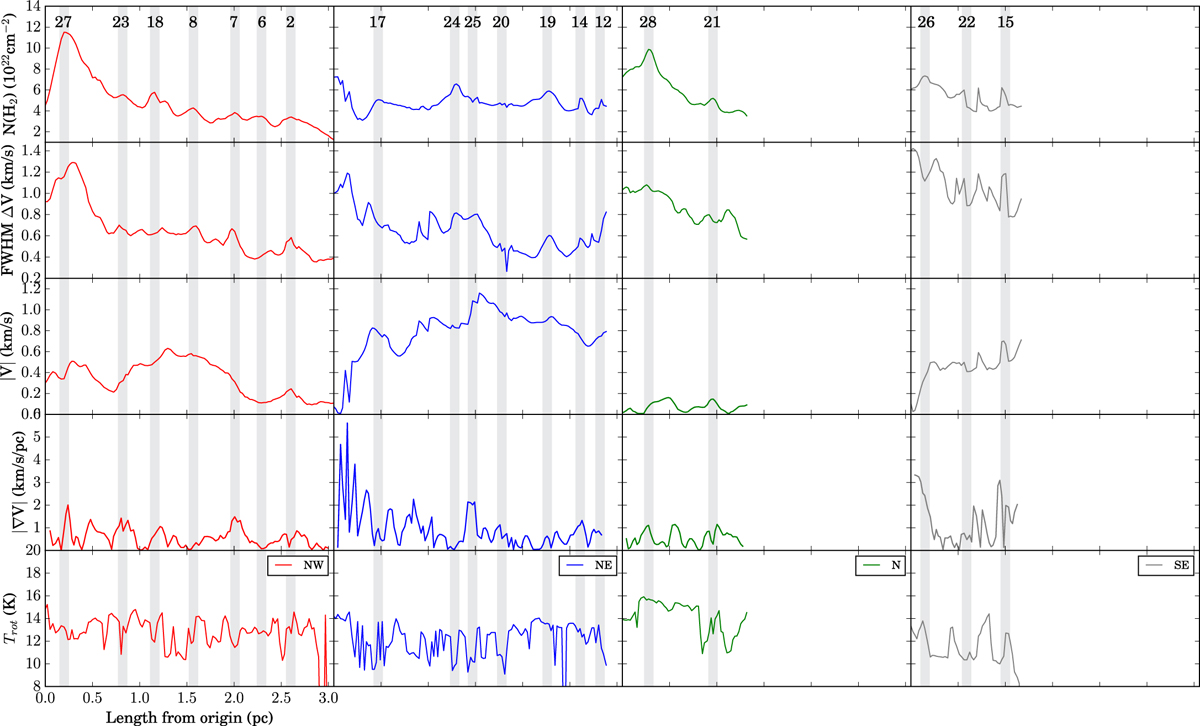
Profiles along the spines, where each column denotes a different filament (north-west in red, north-east in blue, north in green and south-east in grey). The origin of each spine was centred at the hub region. The first row plots the column density of H2 calculated from the fitted NH3 integrated intensity. The second row plots the FWHM velocity width, while the third row plots the absolute centroid line-of-sight velocity (offset from the cloud systemic velocity of 37 km s−1), both also from the hyperfine structure fitting. The fourth row plots the absolute velocity gradient evaluated over the mean core size of ~0.1 pc. The fifth row plots the rotational temperature derived from the NH3 emission (see Appendix B.2) which has a standard deviation of 1.8 K. The drops of temperature below 8 K are artificial and due to missing NH3 (2,2) detections at these particular locations. The vertical shaded regions in each panel correspond to the peak N(H2) positions of the cores along the spine, and are ~0.1 pc wide.
Current usage metrics show cumulative count of Article Views (full-text article views including HTML views, PDF and ePub downloads, according to the available data) and Abstracts Views on Vision4Press platform.
Data correspond to usage on the plateform after 2015. The current usage metrics is available 48-96 hours after online publication and is updated daily on week days.
Initial download of the metrics may take a while.