Fig. 5
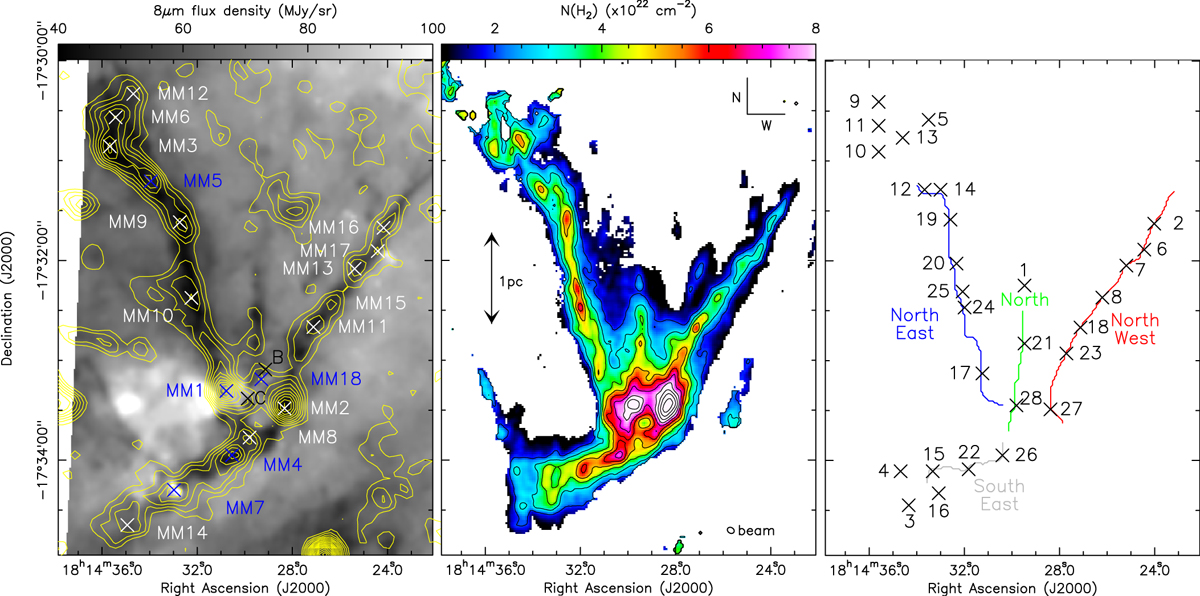
Left: Spitzer 8 μm flux density in units of MJy sr−1, overlaid with IRAM 30m MAMBO 1.2 mm dust continuum contours in steps of 5 mJy beam−1, from 3 to 88 mJy beam−1. Crosses denote the positions of identified 1.2 mm MAMBO compact sources (white for starless and blue for proto-stellar, Peretto et al. 2014) and two 1.3 mm SMA continuum sources (in black crosses, McGuire et al. 2016). Middle: H2 column density map in units of 1022 cm−2, derived fromthe NH3 integrated intensity. Overlaid contours are placed in 1 × 1022 cm−2 steps, from 2 × 1022 cm−2 to 12 × 1022 cm−2. Right: extracted cores (black crosses, numbered according to Table 2) and filaments (labelled coloured lines). The extraction of these structures are discussed in Sect. 4. Extra cores at the outskirts of the north-east and south-east arms are in the more diffuse regions of the cloud where the spines did not extend through. Spine colours match those in subsequent figures.
Current usage metrics show cumulative count of Article Views (full-text article views including HTML views, PDF and ePub downloads, according to the available data) and Abstracts Views on Vision4Press platform.
Data correspond to usage on the plateform after 2015. The current usage metrics is available 48-96 hours after online publication and is updated daily on week days.
Initial download of the metrics may take a while.