Fig. 4
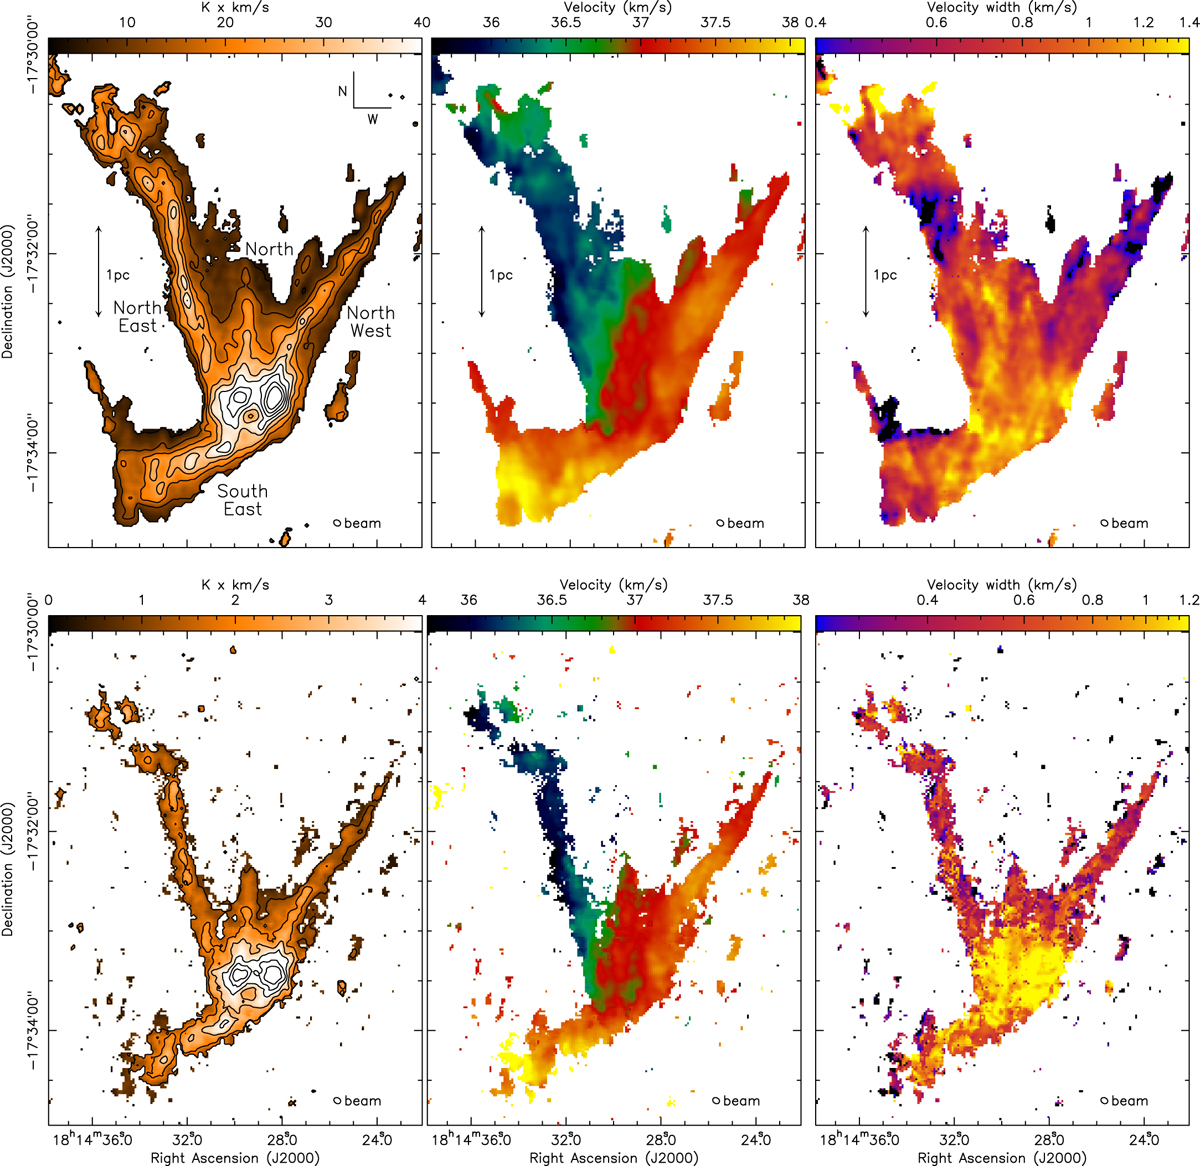
Integrated intensity (first column), centroid velocity (middle column) and velocity width (right column) of the NH3 (1,1) transition (top row) and NH3(2,2) transition (bottom row). The NH3(1,1) data were masked to 5σ, while the weaker NH3(2,2) data were masked to 3σ. Filaments are named in the top left panel. Contours in the top left panel are in steps of 7 K × km s−1, from 5 K × km s−1 to 61 K × km s−1, while contours in the bottom left panel are in steps of 1 K × km s−1, from 1 K × km s−1 to 6 K × km s−1. Beam information is plotted in the bottom right corner of each panel, while the scale of 1 pc is plotted in each panel of the top row.
Current usage metrics show cumulative count of Article Views (full-text article views including HTML views, PDF and ePub downloads, according to the available data) and Abstracts Views on Vision4Press platform.
Data correspond to usage on the plateform after 2015. The current usage metrics is available 48-96 hours after online publication and is updated daily on week days.
Initial download of the metrics may take a while.