Fig. 3
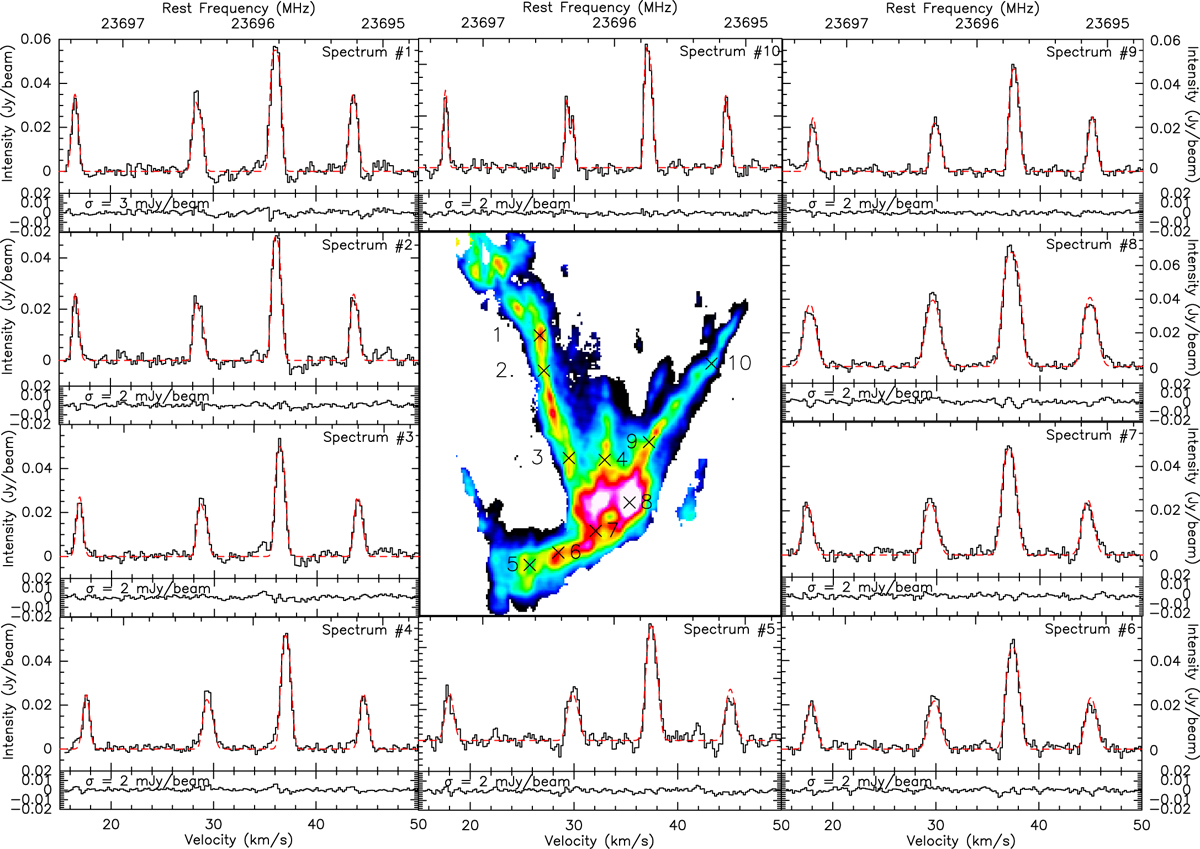
Examples of NH3(1,1) spectra at ten positions in the cloud, plotted surrounding the H2 column density derived from the NH3 emission (discussed later in Sect. 3.2). The model fit is plotted over each spectrum in red, whilst the residual of the two is plotted in the bottom panel with the standard deviation quoted in mJy beam−1. Regions of specific interest include those where the velocity width is seen to increase (spectra 1 and 6), positions where the centroidvelocity changes as a filament meets the central hub (spectra 3, 4 and 7) and the large starless core MM2 (spectrum 8). It is clear that there is only a single velocity component everywhere in the cloud, with some lines being narrow enough to start resolving further hyperfine components (spectrum 10), and some showing the tell-tale signs of the cloud identified by Peretto et al. (2014) at a V sys = 54 kms−1 that likely overlaps in projection with the north-east filament (spectrum 1 and 2).
Current usage metrics show cumulative count of Article Views (full-text article views including HTML views, PDF and ePub downloads, according to the available data) and Abstracts Views on Vision4Press platform.
Data correspond to usage on the plateform after 2015. The current usage metrics is available 48-96 hours after online publication and is updated daily on week days.
Initial download of the metrics may take a while.