Fig. E.1
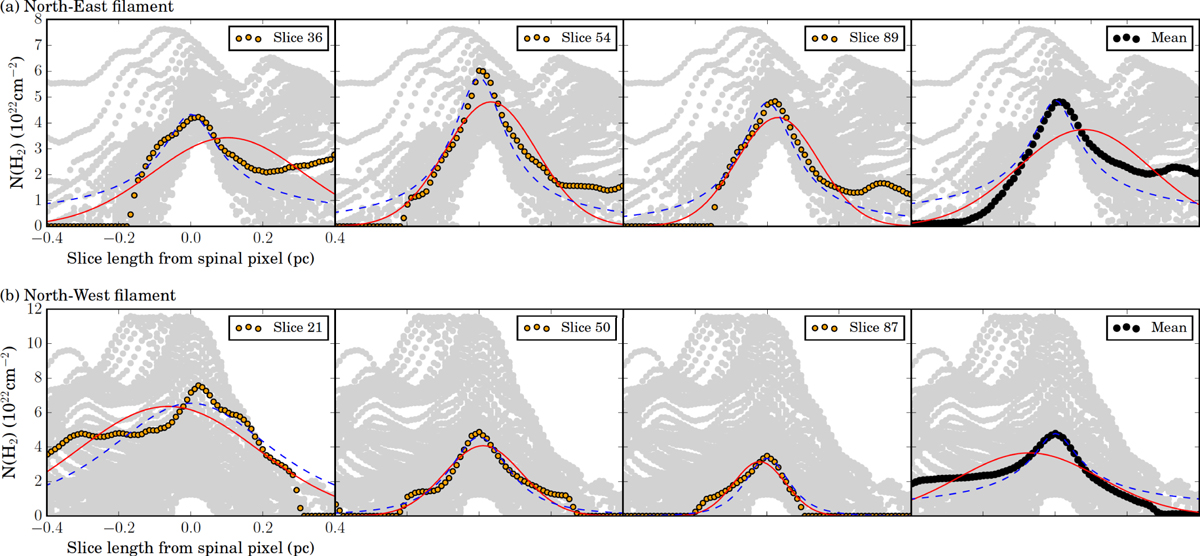
Results of fitting Gaussian (red line) and Plummer (blue dashed line) profiles to individual radial column density slices (orange circles in the first, second and third panels of each row) and the mean radial column density profile (black circles in the fourth panel of each row) of (a) the north-east filament (top row) and (b) the north-west filament (bottom row). The grey points in the background of each panel plots all of the radial column density slices simultaneously. Plummer profiles may on occasion well describe the inner regions of the filaments only, whilst Gaussian profiles fail to fit any of the distributions. Gaussian profiles are only found to reasonably fit some of the data once the fitting range is restricted tothe inner portion of the filament.
Current usage metrics show cumulative count of Article Views (full-text article views including HTML views, PDF and ePub downloads, according to the available data) and Abstracts Views on Vision4Press platform.
Data correspond to usage on the plateform after 2015. The current usage metrics is available 48-96 hours after online publication and is updated daily on week days.
Initial download of the metrics may take a while.