Fig. B.2
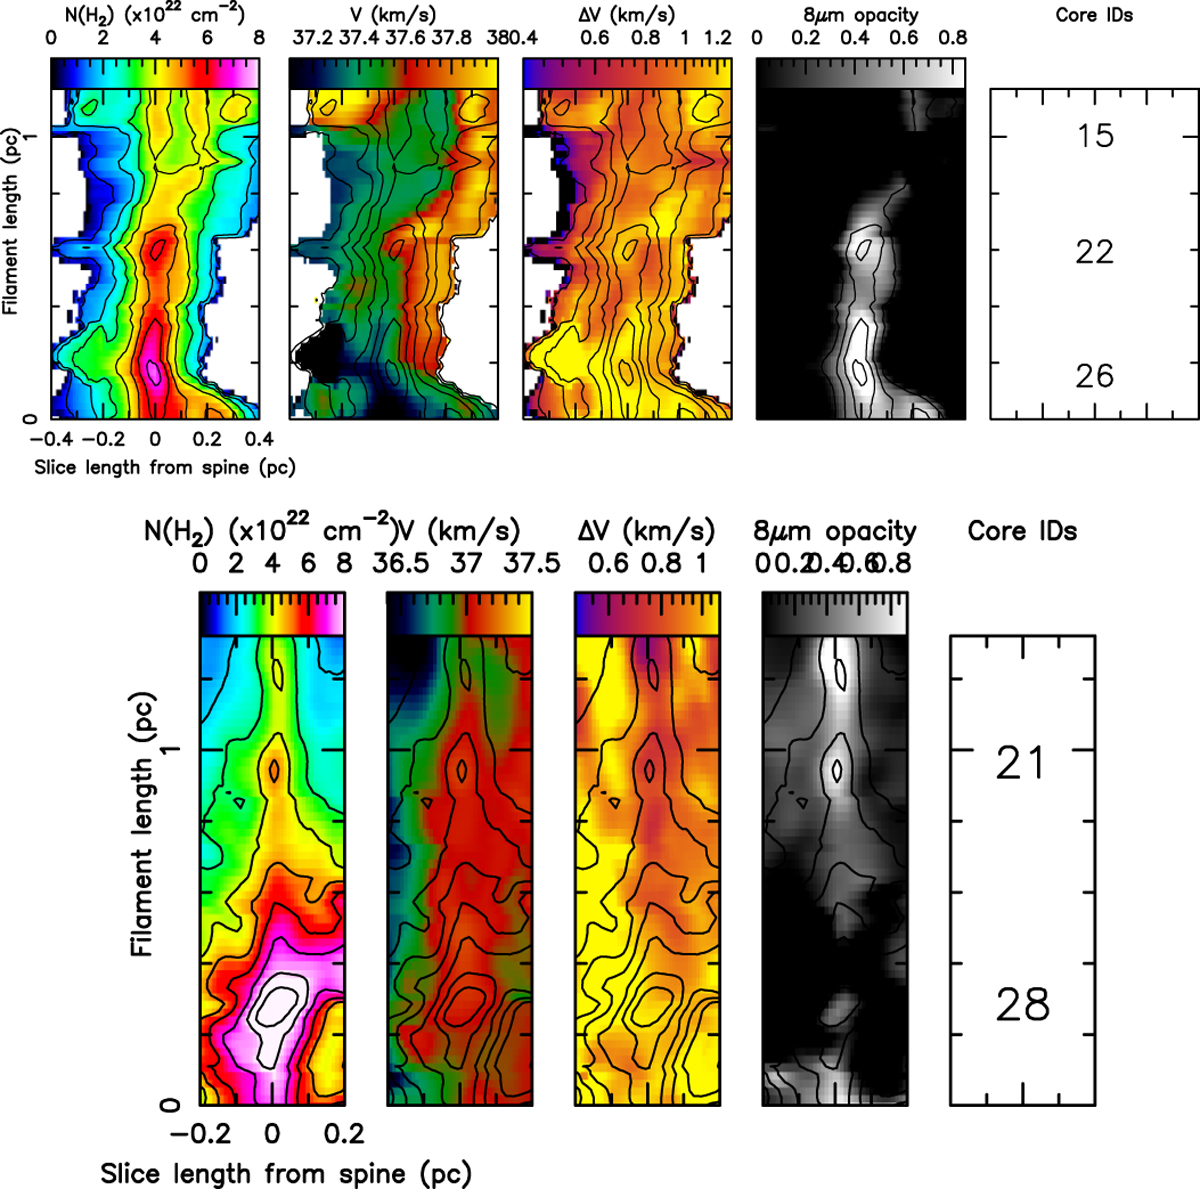
Deprojected views of the south-east (top) and north (bottom) filaments. The north filament was restricted to 0.2 pc either side of the spine due to contamination from the north-west and north-east filaments. The filament length is plotted on the y-axis, while the length of the radial slices from the central spine pixel in plotted on the x-axis. In both sub-figures (from the left), the first panel shows the H2 column density in units of 1022 cm−2, the second panel shows the line-of-sight velocity in km s−1, the third panel shows the velocity width in km s−1, the fourth panel shows the opacity derived from the 8 μm Spitzer emission, whilst the final panel labels the ID number of the identified cores. Contours in each panel are of the column density, from 1 × 1022 cm−2 to 11 × 1022 cm−2, spaced by 1 × 1022 cm−2.
Current usage metrics show cumulative count of Article Views (full-text article views including HTML views, PDF and ePub downloads, according to the available data) and Abstracts Views on Vision4Press platform.
Data correspond to usage on the plateform after 2015. The current usage metrics is available 48-96 hours after online publication and is updated daily on week days.
Initial download of the metrics may take a while.