Fig. B.1
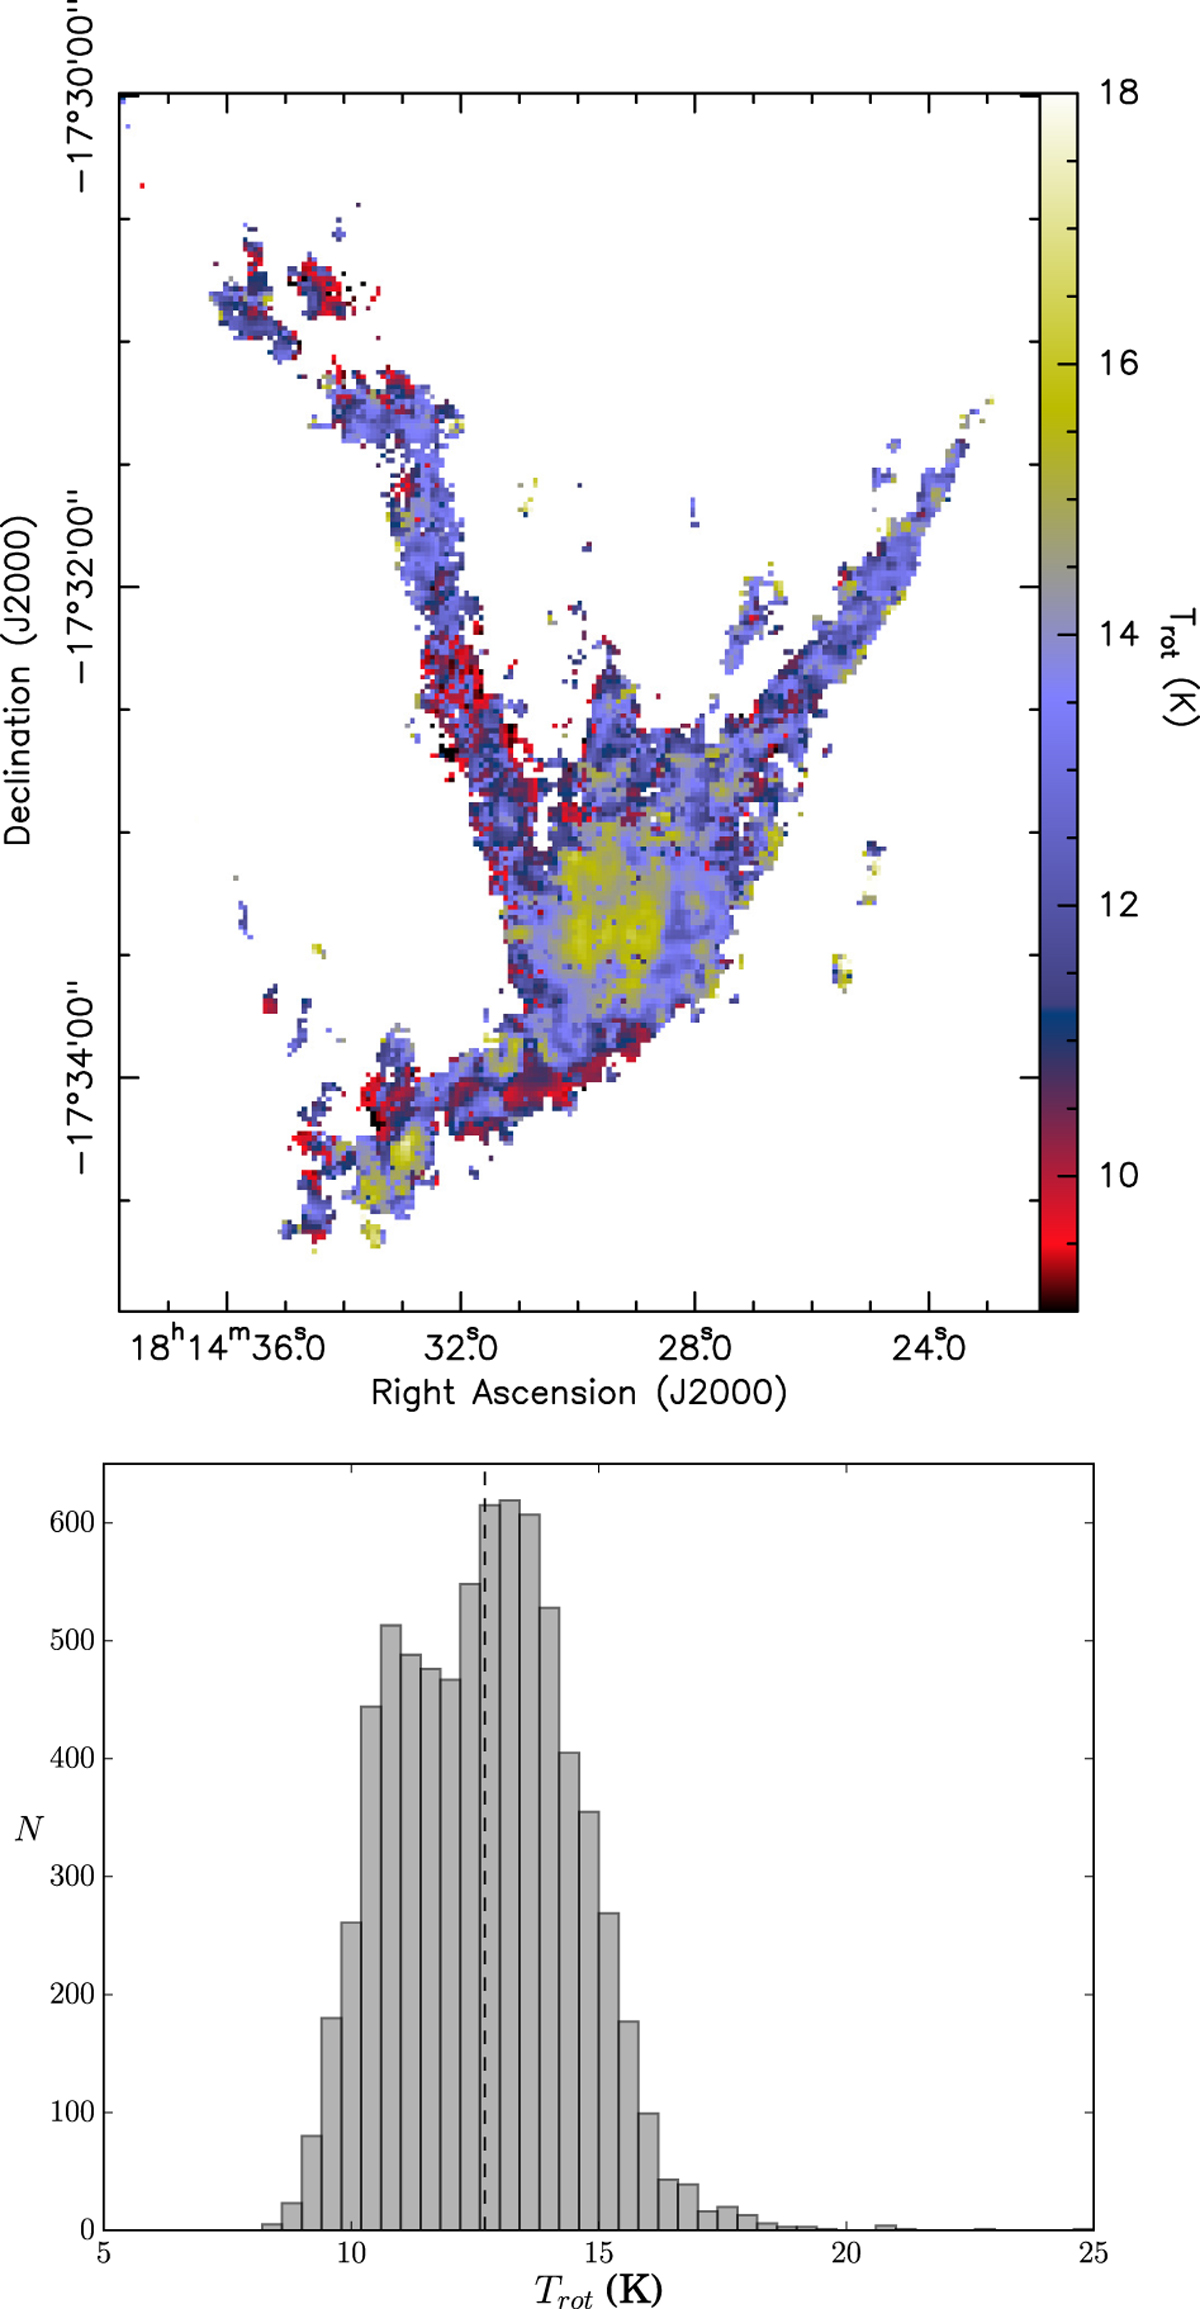
Top: map of the rotational temperature calculated using Eq. (B.3). It is clear that the coverage of the image is limited to that of the weaker NH3 (2,2) line. No correlation is found between temperature and core position. Bottom: histogram of the Trot map in the top panel. Vertical dashed line indicates the median value of 12.7 K. The standard deviation is 1.8 K.
Current usage metrics show cumulative count of Article Views (full-text article views including HTML views, PDF and ePub downloads, according to the available data) and Abstracts Views on Vision4Press platform.
Data correspond to usage on the plateform after 2015. The current usage metrics is available 48-96 hours after online publication and is updated daily on week days.
Initial download of the metrics may take a while.