Fig. 21
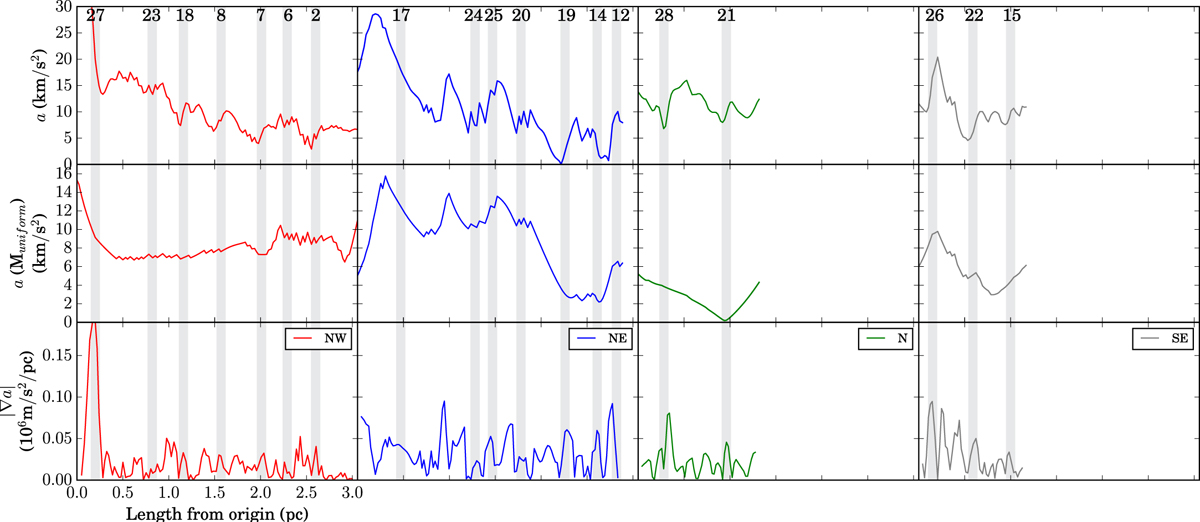
Profiles along the spines, where each column denotes a different filamentary arm, as labelled (north-west in red, north-east in blue, north in green and south-east in grey). The origin of each of the spines was defined to begin at the heart of the hub. First row: acceleration due to gravity in SDC13 where the mass was calculated using the H2 column density map, while a uniform, mean cloud mass was used for the acceleration in the second row. Third row: absolute gradient of the acceleration from row three evaluated at each position over the mean core size of ~0.1 pc. The vertical shaded regions correspond to the positions of the cores along each of the filaments, are ~0.1 pc wide and overplotted by the core ID number in Table 2.
Current usage metrics show cumulative count of Article Views (full-text article views including HTML views, PDF and ePub downloads, according to the available data) and Abstracts Views on Vision4Press platform.
Data correspond to usage on the plateform after 2015. The current usage metrics is available 48-96 hours after online publication and is updated daily on week days.
Initial download of the metrics may take a while.