Fig. 13
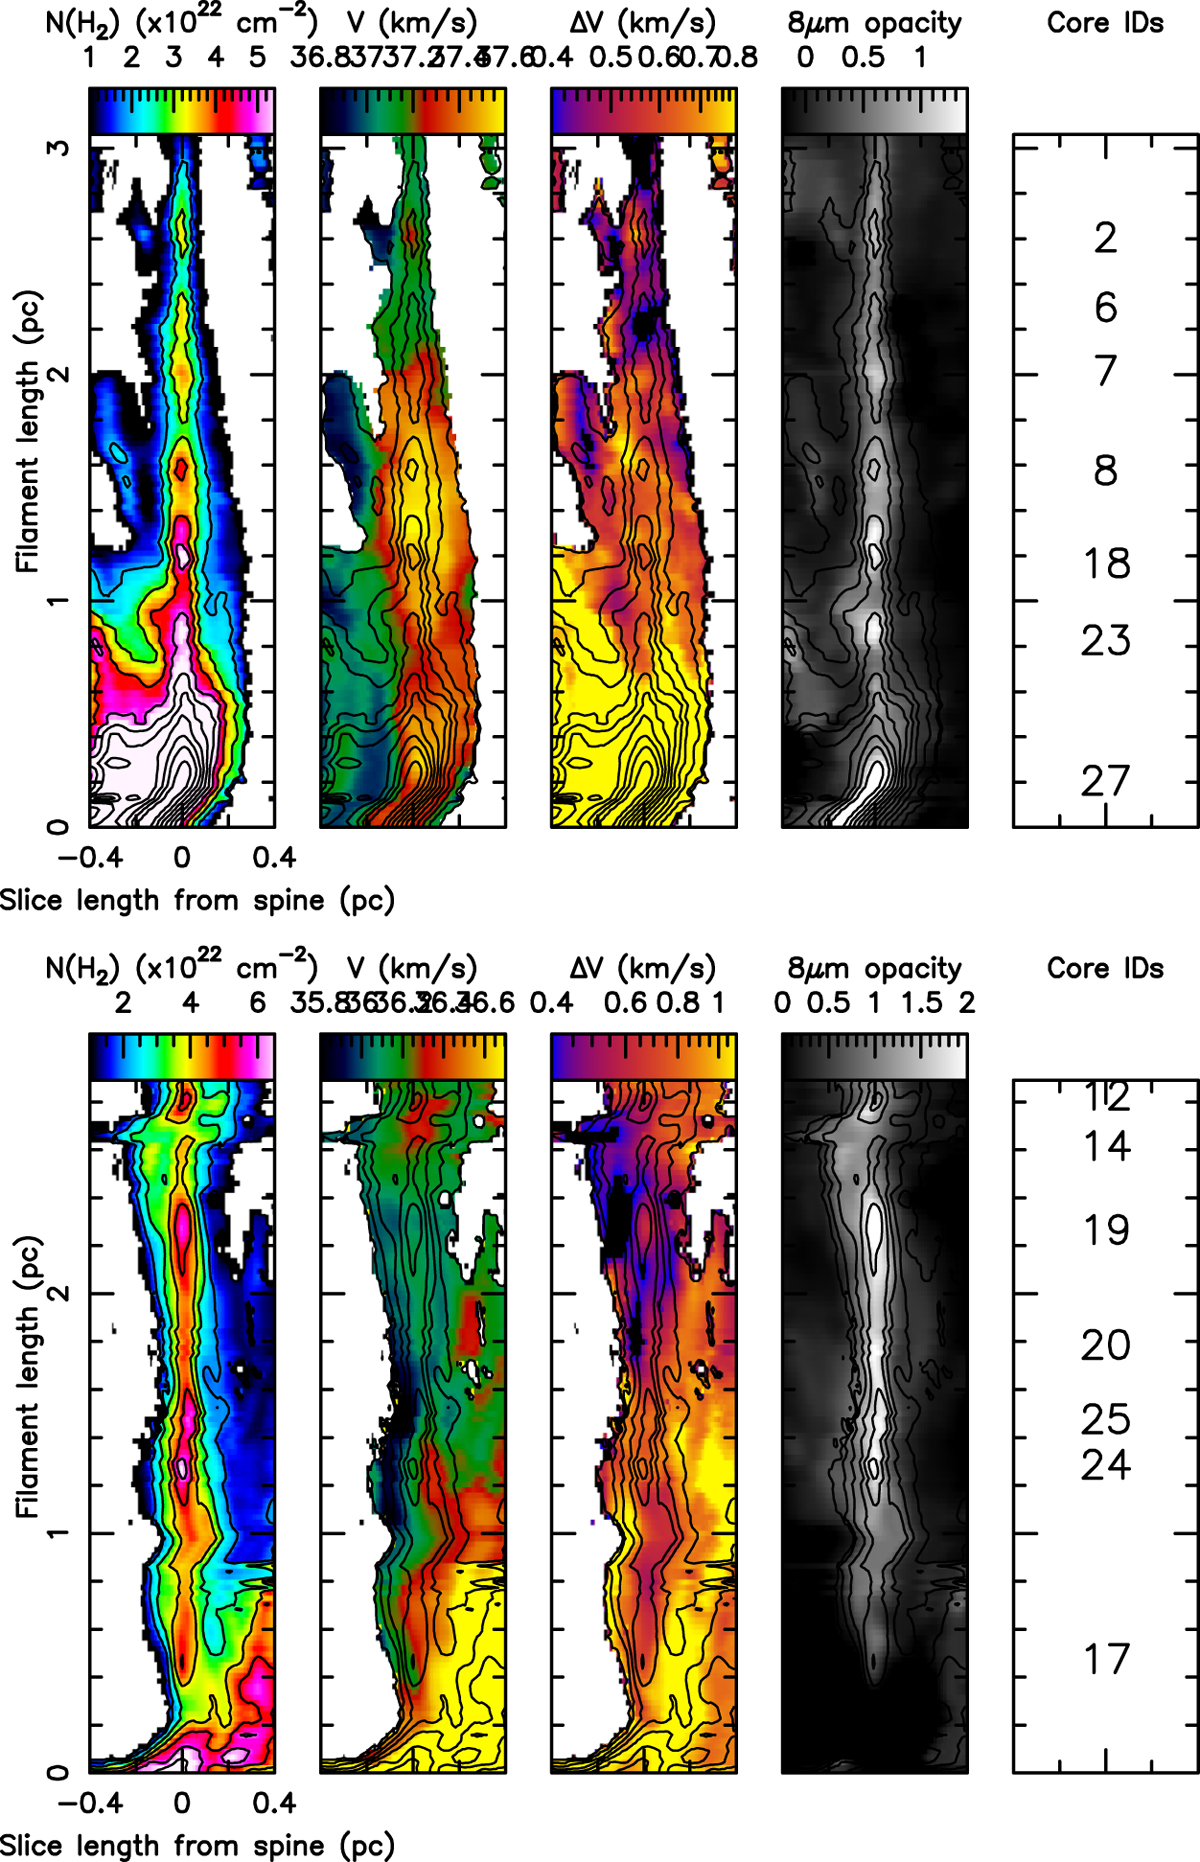
Deprojected views of the north-west (top) and north-east (bottom) filaments. The filament length is plotted on the y-axis, while the length of the radial slices from the central spine pixel in plotted on the x-axis. In both sub-figures, the panels show (from left to right) the H2 column density derived from the NH3 emission, the line-of-sight velocity, the velocity width, the opacity derived from the 8 μm Spitzer emission, and finally the core ID as listed in Table 2. Contours in the first four panels are of the column density, from 1 × 1022 cm−2 to 11 × 1022 cm−2, spaced by 1 × 1022 cm−2. The plots for the south-east and north filaments are in Appendix C.
Current usage metrics show cumulative count of Article Views (full-text article views including HTML views, PDF and ePub downloads, according to the available data) and Abstracts Views on Vision4Press platform.
Data correspond to usage on the plateform after 2015. The current usage metrics is available 48-96 hours after online publication and is updated daily on week days.
Initial download of the metrics may take a while.