Fig. 12
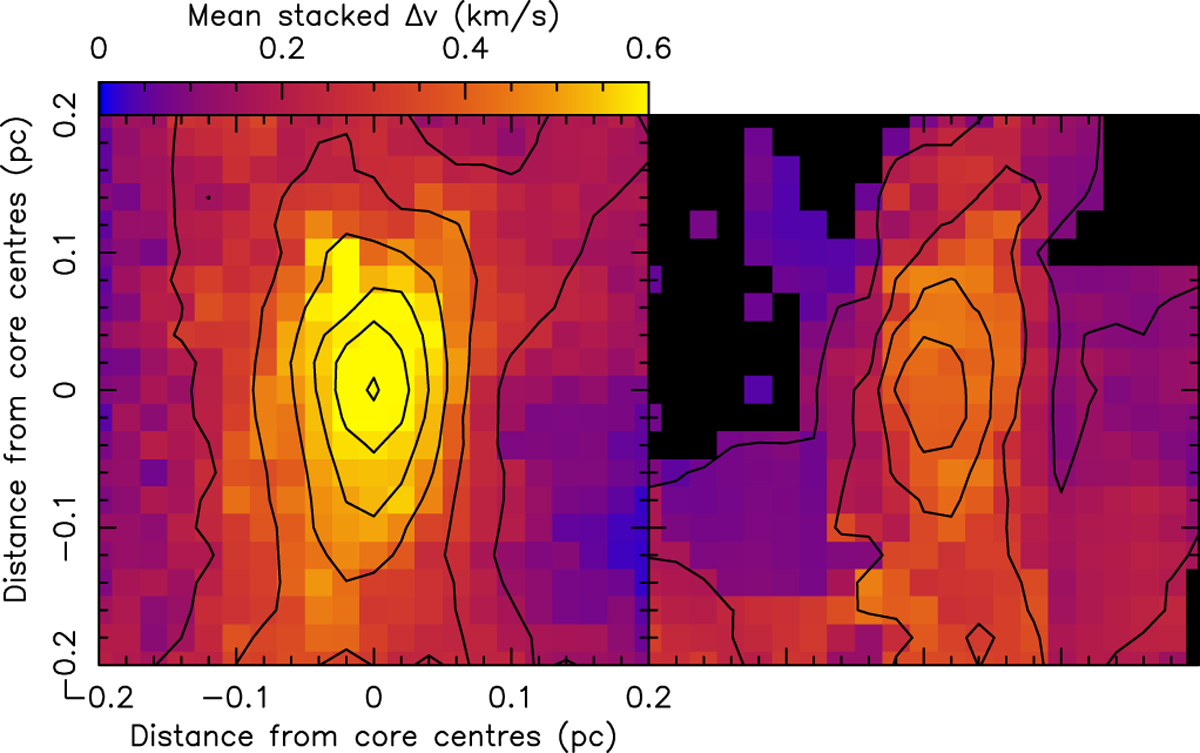
Reproduction of Fig. 7, but for the JVLA-only data. The average stacked velocity width of cores identified with velocity width peaks (left) and those without peaks (right). Included in the construction of the left and right panels are 13 and 4 cores, respectively. Plot details are the same as those detailed in the caption of Fig. 7.
Current usage metrics show cumulative count of Article Views (full-text article views including HTML views, PDF and ePub downloads, according to the available data) and Abstracts Views on Vision4Press platform.
Data correspond to usage on the plateform after 2015. The current usage metrics is available 48-96 hours after online publication and is updated daily on week days.
Initial download of the metrics may take a while.