Fig. 10
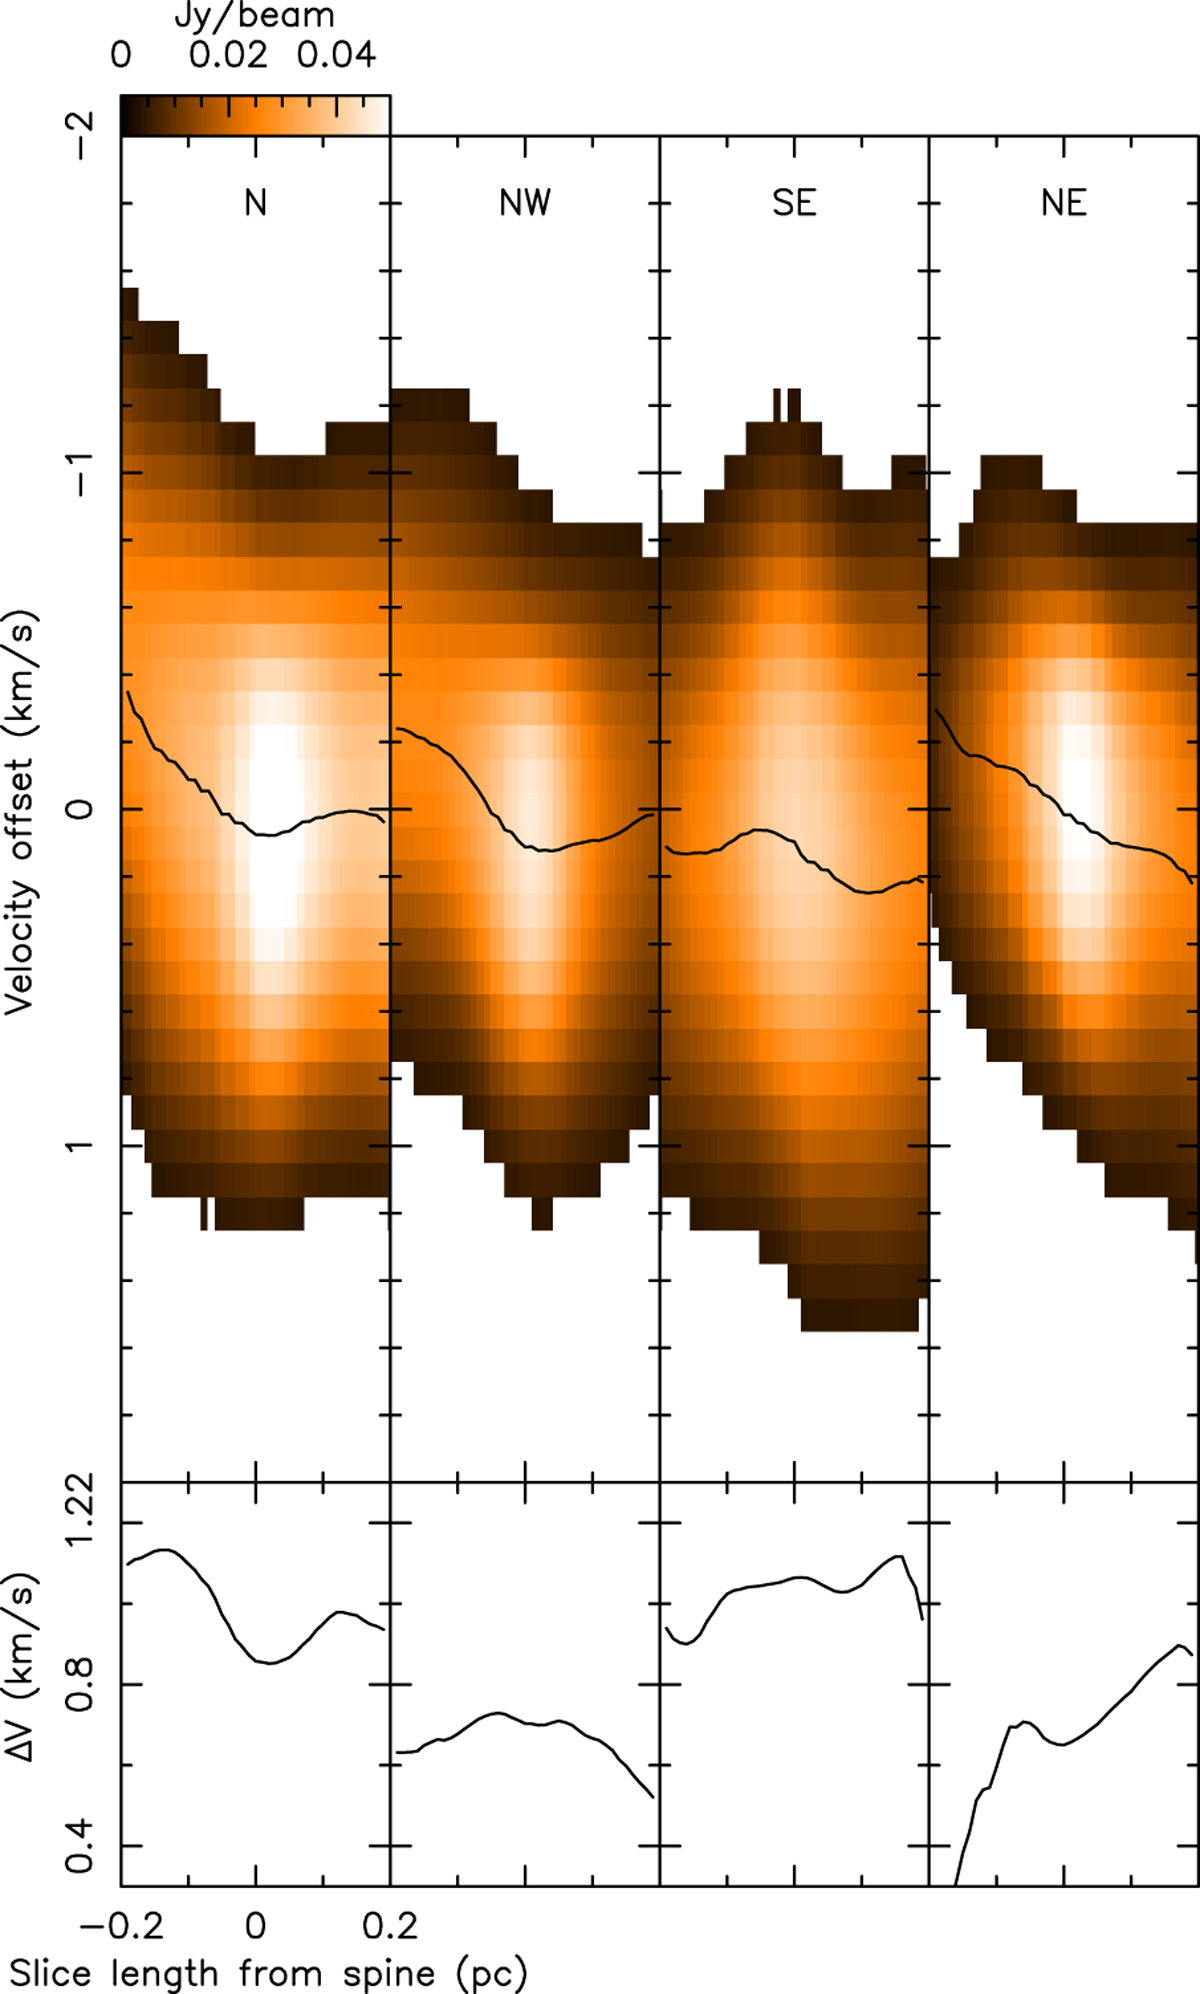
Top:mean position-velocity diagrams across the north, north-west, south-east and north-east filaments (from left to right), where position denotes the length of a perpendicular slice relative to the central spine pixel in parsec, and the velocity are relative to the peak velocity of each slice. The overplotted black line shows the trend of the intensity-weighted mean offset velocity at each position along the radial slice. Mean radial gradients were computed within the inner 0.2 pc width around the spinal pixel. Bottom: mean variation in the velocity width in the radial direction, in km s−1.
Current usage metrics show cumulative count of Article Views (full-text article views including HTML views, PDF and ePub downloads, according to the available data) and Abstracts Views on Vision4Press platform.
Data correspond to usage on the plateform after 2015. The current usage metrics is available 48-96 hours after online publication and is updated daily on week days.
Initial download of the metrics may take a while.